Honeywell 2005 Annual Report Download - page 40
Download and view the complete annual report
Please find page 40 of the 2005 Honeywell annual report below. You can navigate through the pages in the report by either clicking on the pages listed below, or by using the keyword search tool below to find specific information within the annual report.-
 1
1 -
2
-
3
-
4
-
5
-
6
-
7
-
8
-
9
-
10
-
11
-
12
-
13
-
14
-
15
-
16
-
17
-
18
-
19
-
20
-
21
-
22
-
23
-
24
-
25
-
26
-
27
-
28
-
29
-
 30
30 -
 31
31 -
 32
32 -
 33
33 -
 34
34 -
 35
35 -
 36
36 -
 37
37 -
 38
38 -
 39
39 -
 40
40 -
 41
41 -
 42
42 -
 43
43 -
 44
44 -
 45
45 -
 46
46 -
 47
47 -
 48
48 -
 49
49 -
 50
50 -
51
-
52
-
53
-
54
-
55
-
56
-
57
-
58
-
59
-
60
-
61
-
62
-
63
-
64
-
65
-
66
-
67
-
68
-
69
-
70
-
71
-
72
-
73
-
74
-
75
-
76
-
77
-
78
-
79
-
80
-
81
-
82
-
83
-
84
-
85
-
86
-
87
-
88
-
89
-
90
-
91
-
92
-
93
-
94
-
95
-
96
-
97
-
98
-
99
-
100
-
101
-
102
-
103
-
104
-
105
-
106
-
107
-
108
-
109
-
110
-
111
-
112
-
113
-
114
-
115
-
116
-
117
-
118
-
119
-
120
-
121
-
122
-
123
-
124
-
125
-
126
-
127
-
128
-
129
-
130
-
131
-
132
-
133
-
134
-
135
-
136
-
137
-
138
-
139
-
140
-
141
-
142
-
143
-
144
-
145
-
146
-
147
-
148
-
149
-
150
-
151
-
152
-
153
-
154
-
155
-
156
-
157
-
158
-
159
-
160
-
161
-
162
-
163
-
164
-
165
-
166
-
167
-
168
-
169
-
170
-
171
-
172
-
173
-
174
-
175
-
176
-
177
-
178
-
179
-
180
-
181
-
182
-
183
-
184
-
185
-
186
-
187
-
188
-
189
-
190
-
191
-
192
-
193
-
194
-
195
-
196
-
197
-
198
-
199
-
200
-
201
-
202
-
203
-
204
-
205
-
206
-
207
-
208
-
209
-
210
-
211
-
212
-
213
-
214
-
215
-
216
-
217
-
218
-
219
-
220
-
221
-
222
-
223
-
224
-
225
-
226
-
227
-
228
-
229
-
230
-
231
-
232
-
233
-
234
-
235
-
236
-
237
-
238
-
239
-
240
-
241
-
242
-
243
-
244
-
245
-
246
-
247
-
248
-
249
-
250
-
251
-
252
-
253
-
254
-
255
-
256
-
257
-
258
-
259
-
260
-
261
-
262
-
263
-
264
-
265
-
266
-
267
-
268
-
269
-
270
-
271
-
272
-
273
-
274
-
275
-
276
-
277
-
278
-
279
-
280
-
281
-
282
-
283
-
284
-
285
-
286
 |
 |

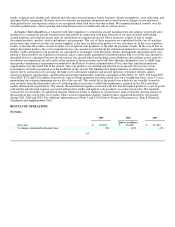
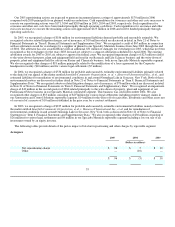
Income From Continuing Operations
2005 2004 2003
(Dollars in millions,
except per share amounts)
Income from continuing operations $ 1,581 $ 1,281 $ 1,344
Earnings per share of common stock—assuming dilution $ 1.86 $ 1.49 $ 1.56
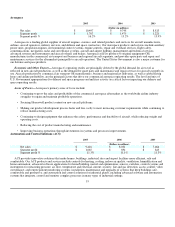
The increase of $0.37 per share in 2005 compared with 2004 relates primarily to an increase in segment profit for our reportable
segments. See Review of Business Segments for a discussion of our segment results. The decrease of $0.07 per share in 2004
compared with 2003 relates primarily to increased charges for environmental matters primarily attributable to the denial of our appeal
in the matter entitled Interfaith Community Organization et. al. v. Honeywell International Inc. et. al. (See Note 21 of Notes to
Financial Statements in “Item 8. Financial Statements and Supplementary Data”) and higher pension and other postretirement benefits
expense, partially offset by an increase in segment profit.
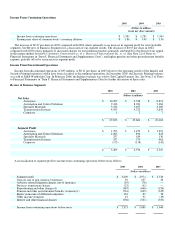
Income From Discontinued Operations
Income from discontinued operations of $95 million, or $0.11 per share, in 2005 relates to the operating results of the Indalex and
Security Printing businesses which have been classified as discontinued operations. In December 2005, the Security Printing business
was sold to M&F Worldwide Corp. In February 2006, the Indalex business was sold to Sun Capital Partners, Inc. See Note 2 of Notes
to Financial Statements in “Item 8. Financial Statements and Supplementary Data for further discussion of these sales.
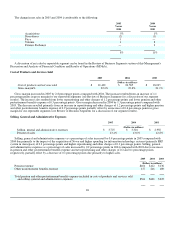
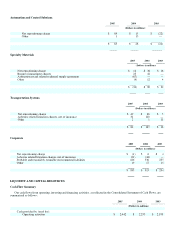
Review of Business Segments
2005 2004 2003
(Dollars in millions)
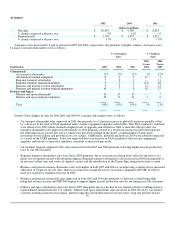
Net Sales
Aerospace $ 10,497 $ 9,748 $ 8,813
Automation and Control Solutions 9,416 8,031 7,464
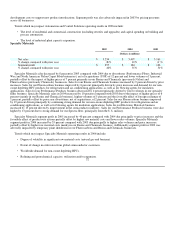
Specialty Materials 3,234 3,497 3,169
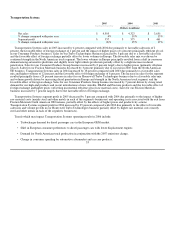
Transportation Systems 4,505 4,323 3,650
Corporate 1 2 7
$ 27,653 $ 25,601 $ 23,103
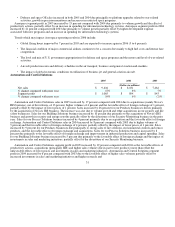
Segment Profit
Aerospace $ 1,703 $ 1,479 $ 1,221
Automation and Control Solutions 1,065 894 843
Specialty Materials 257 184 136
Transportation Systems 557 575 461
Corporate (173) (158) (142)
$ 3,409 $ 2,974 $ 2,519
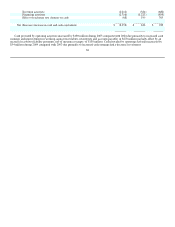
A reconciliation of segment profit to income from continuing operations before taxes follows:
2005 2004 2003
(Dollars in millions)
Segment profit $ 3,409 $ 2,974 $ 2,519
Gain on sale of non-strategic businesses 36 255 38
Asbestos related litigation charges, net of insurance (10) (76) —
Business impairment charges (23) (42) —
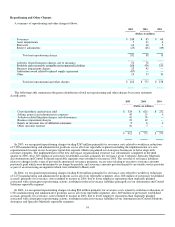
Repositioning and other charges(1) (367) (646) (276)
Pension and other postretirement benefits (expense)(1) (561) (628) (325)
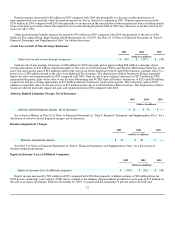
Equity in income of affiliated companies 134 82 38
Other income (expense) 61 92 (19)
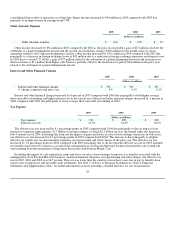
Interest and other financial charges (356) (331) (335)
Income from continuing operations before taxes $ 2,323 $ 1,680 $ 1,640