Honeywell 2005 Annual Report Download - page 42
Download and view the complete annual report
Please find page 42 of the 2005 Honeywell annual report below. You can navigate through the pages in the report by either clicking on the pages listed below, or by using the keyword search tool below to find specific information within the annual report.-
 1
1 -
2
-
3
-
4
-
5
-
6
-
7
-
8
-
9
-
10
-
11
-
12
-
13
-
14
-
15
-
16
-
17
-
18
-
19
-
20
-
21
-
22
-
23
-
24
-
25
-
26
-
27
-
28
-
29
-
30
-
31
-
 32
32 -
 33
33 -
 34
34 -
 35
35 -
 36
36 -
 37
37 -
 38
38 -
 39
39 -
 40
40 -
 41
41 -
 42
42 -
 43
43 -
 44
44 -
 45
45 -
 46
46 -
 47
47 -
 48
48 -
 49
49 -
 50
50 -
 51
51 -
 52
52 -
53
-
54
-
55
-
56
-
57
-
58
-
59
-
60
-
61
-
62
-
63
-
64
-
65
-
66
-
67
-
68
-
69
-
70
-
71
-
72
-
73
-
74
-
75
-
76
-
77
-
78
-
79
-
80
-
81
-
82
-
83
-
84
-
85
-
86
-
87
-
88
-
89
-
90
-
91
-
92
-
93
-
94
-
95
-
96
-
97
-
98
-
99
-
100
-
101
-
102
-
103
-
104
-
105
-
106
-
107
-
108
-
109
-
110
-
111
-
112
-
113
-
114
-
115
-
116
-
117
-
118
-
119
-
120
-
121
-
122
-
123
-
124
-
125
-
126
-
127
-
128
-
129
-
130
-
131
-
132
-
133
-
134
-
135
-
136
-
137
-
138
-
139
-
140
-
141
-
142
-
143
-
144
-
145
-
146
-
147
-
148
-
149
-
150
-
151
-
152
-
153
-
154
-
155
-
156
-
157
-
158
-
159
-
160
-
161
-
162
-
163
-
164
-
165
-
166
-
167
-
168
-
169
-
170
-
171
-
172
-
173
-
174
-
175
-
176
-
177
-
178
-
179
-
180
-
181
-
182
-
183
-
184
-
185
-
186
-
187
-
188
-
189
-
190
-
191
-
192
-
193
-
194
-
195
-
196
-
197
-
198
-
199
-
200
-
201
-
202
-
203
-
204
-
205
-
206
-
207
-
208
-
209
-
210
-
211
-
212
-
213
-
214
-
215
-
216
-
217
-
218
-
219
-
220
-
221
-
222
-
223
-
224
-
225
-
226
-
227
-
228
-
229
-
230
-
231
-
232
-
233
-
234
-
235
-
236
-
237
-
238
-
239
-
240
-
241
-
242
-
243
-
244
-
245
-
246
-
247
-
248
-
249
-
250
-
251
-
252
-
253
-
254
-
255
-
256
-
257
-
258
-
259
-
260
-
261
-
262
-
263
-
264
-
265
-
266
-
267
-
268
-
269
-
270
-
271
-
272
-
273
-
274
-
275
-
276
-
277
-
278
-
279
-
280
-
281
-
282
-
283
-
284
-
285
-
286
 |
 |

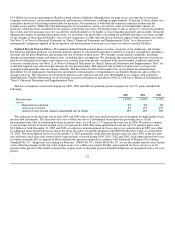
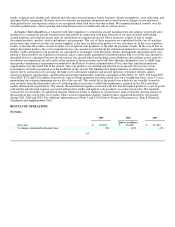
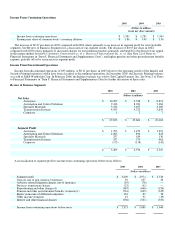
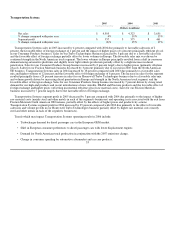
Aerospace
2005 2004 2003
(Dollars in millions)
Net sales $ 10,497 $ 9,748 $ 8,813
% change compared with prior year 8% 11% —%
Segment profit $ 1,703 $ 1,479 $ 1,221
% change compared with prior year 15% 21% (7)%
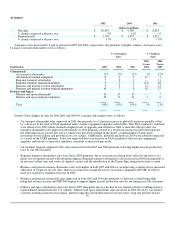
Aerospace sales increased by 8 and 11 percent in 2005 and 2004, respectively, due primarily to higher volumes. Aerospace sales
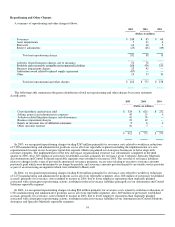
by major customer end-markets were as follows:
% of Aerospace
Sales % Change in
Sales
End-Markets
2005
2004
2003
2005
Versus
2004
2004
Versus
2003
Commercial:
Air transport aftermarket 22% 22% 21% 5% 19%
Air transport original equipment 9 9 9 15 5
Regional transport aftermarket 7 8 9 — 11
Regional transport original equipment 2 3 2 (13) 48
Business and general aviation aftermarket 9 8 8 11 13
Business and general aviation original equipment 10 7 6 42 27
Defense and Space:
Defense and space aftermarket 12 13 13 — 7
Defense and space original equipment 29 30 32 3 6
Total 100% 100% 100% 8% 11%
Details of the changes in sales for both 2005 and 2004 by customer end-markets were as follows:
• Air transport aftermarket sales improved in 2005 due primarily to a 7 percent increase in global flying hours partially offset
by a decrease in the level of FAA-mandated safety avionics equipment upgrades and retrofits. New FAA regulatory standards
were effective for 2005 which resulted in higher levels of upgrades and retrofits in 2004 to meet the effective date. Air
transport aftermarket sales improved substantially in 2004 primarily related to a 10 percent increase in global flying hours,
the reintroduction of aircraft into service which were previously parked in the desert, a replenishment of spare parts
inventories by the airlines and growth in low cost carriers. Additionally, global flying hours in 2003 were adversely impacted
as a result of the SARS epidemic. Sales also improved due to an increase in FAA-mandated safety avionics equipment
upgrades and retrofits to meet new regulatory standards as discussed previously.
• Air transport original equipment (OE) sales increased in both 2005 and 2004 primarily reflecting higher aircraft production
rates by our OE customers.
• Regional transport aftermarket sales were flat in 2005 primarily due to an increase in flying hours offset by the effects of a
phase-out of regional aircraft with turboprop engines. Regional transport aftermarket sales increased in 2004 due primarily to
an increase in fleet sizes and routes of regional carriers and the introduction of the Primus Epic integrated avionics system.
• Business and general aviation aftermarket sales were higher in both 2005 and 2004 as an improving economy drove increased
utilization of corporate aircraft. Also, there was an increase in upgrade activity in avionics equipment (RVSM) in 2004 to
meet new regulatory standards effective in 2005.
• Business and general aviation OE sales improved in both 2005 and 2004 due primarily to deliveries of the Primus Epic
integrated avionics system and HTF7000 engine to support higher aircraft production rates by our business jet OE customers.
• Defense and space aftermarket sales were flat in 2005 principally due to a decline in war-related activities resulting in lower
replenishment demand from the U.S. military. Defense and space aftermarket sales increased in 2004 driven by war-related
activities resulting in increases in repairs, platform upgrades and modifications for fixed, rotary wing and ground vehicles.
30