Honeywell 2005 Annual Report Download - page 34
Download and view the complete annual report
Please find page 34 of the 2005 Honeywell annual report below. You can navigate through the pages in the report by either clicking on the pages listed below, or by using the keyword search tool below to find specific information within the annual report.-
 1
1 -
2
-
3
-
4
-
5
-
6
-
7
-
8
-
9
-
10
-
11
-
12
-
13
-
14
-
15
-
16
-
17
-
18
-
19
-
20
-
21
-
22
-
23
-
 24
24 -
 25
25 -
 26
26 -
 27
27 -
 28
28 -
 29
29 -
 30
30 -
 31
31 -
 32
32 -
 33
33 -
 34
34 -
 35
35 -
 36
36 -
 37
37 -
 38
38 -
 39
39 -
 40
40 -
 41
41 -
 42
42 -
 43
43 -
 44
44 -
45
-
46
-
47
-
48
-
49
-
50
-
51
-
52
-
53
-
54
-
55
-
56
-
57
-
58
-
59
-
60
-
61
-
62
-
63
-
64
-
65
-
66
-
67
-
68
-
69
-
70
-
71
-
72
-
73
-
74
-
75
-
76
-
77
-
78
-
79
-
80
-
81
-
82
-
83
-
84
-
85
-
86
-
87
-
88
-
89
-
90
-
91
-
92
-
93
-
94
-
95
-
96
-
97
-
98
-
99
-
100
-
101
-
102
-
103
-
104
-
105
-
106
-
107
-
108
-
109
-
110
-
111
-
112
-
113
-
114
-
115
-
116
-
117
-
118
-
119
-
120
-
121
-
122
-
123
-
124
-
125
-
126
-
127
-
128
-
129
-
130
-
131
-
132
-
133
-
134
-
135
-
136
-
137
-
138
-
139
-
140
-
141
-
142
-
143
-
144
-
145
-
146
-
147
-
148
-
149
-
150
-
151
-
152
-
153
-
154
-
155
-
156
-
157
-
158
-
159
-
160
-
161
-
162
-
163
-
164
-
165
-
166
-
167
-
168
-
169
-
170
-
171
-
172
-
173
-
174
-
175
-
176
-
177
-
178
-
179
-
180
-
181
-
182
-
183
-
184
-
185
-
186
-
187
-
188
-
189
-
190
-
191
-
192
-
193
-
194
-
195
-
196
-
197
-
198
-
199
-
200
-
201
-
202
-
203
-
204
-
205
-
206
-
207
-
208
-
209
-
210
-
211
-
212
-
213
-
214
-
215
-
216
-
217
-
218
-
219
-
220
-
221
-
222
-
223
-
224
-
225
-
226
-
227
-
228
-
229
-
230
-
231
-
232
-
233
-
234
-
235
-
236
-
237
-
238
-
239
-
240
-
241
-
242
-
243
-
244
-
245
-
246
-
247
-
248
-
249
-
250
-
251
-
252
-
253
-
254
-
255
-
256
-
257
-
258
-
259
-
260
-
261
-
262
-
263
-
264
-
265
-
266
-
267
-
268
-
269
-
270
-
271
-
272
-
273
-
274
-
275
-
276
-
277
-
278
-
279
-
280
-
281
-
282
-
283
-
284
-
285
-
286
 |
 |

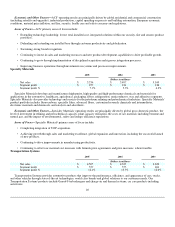
Changes in net periodic pension expense may occur in the future due to changes in our expected rate of return on plan assets and
discount rate resulting from economic events. The following table highlights the sensitivity of our U.S. pension obligations and
expense to changes in these assumptions, assuming all other assumptions remain constant:
Change in Assumption
Impact on Annual
Pension Expense Impact on PBO
0.25 percentage point decrease in discount rate Increase $50 million Increase $325 million
0.25 percentage point increase in discount rate Decrease $50 million Decrease $325 million
0.25 percentage point decrease in expected rate of return on assets Increase $30 million —
0.25 percentage point increase in expected rate of return on assets Decrease $30 million —
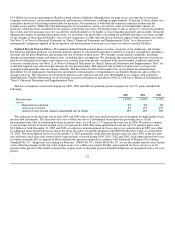
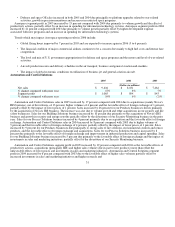
Net periodic pension expense for our pension plans is expected to be approximately $320 million in 2006, a $84 million decrease
from 2005 due principally to a decrease in the amortization of unrecognized net losses. The decline in the amortization of
unrecognized net losses results principally from actual plan asset returns higher than the expected rate of return in 2003 and 2004.
In 2005, 2004 and 2003 we were not required to make a contribution to satisfy minimum statutory funding requirements in our
U.S. pension plans. We made voluntary contributions of $40 and $670 million to our U.S. pension plans in 2004 and 2003,
respectively. The 2003 voluntary contribution was made to improve the funded status of the plans which had been impacted by the
poor performance of the equity markets during the three-year period ended December 31, 2002, as well as the declining interest rate
environment. Future plan contributions are dependent upon actual plan asset returns and interest rates. Assuming that actual plan
returns are consistent with our expected plan return of 9 percent in 2006 and beyond, and that interest rates remain constant, we would
not be required to make any contributions to our U.S. pension plans to satisfy minimum statutory funding requirements for the
foreseeable future. However, we expect to make voluntary contributions of approximately $45 million in cash in 2006 to certain of our
U.S. pension plans for government contracting purposes. We also expect to contribute approximately $150 million in cash in 2006 to
our non-U.S. defined benefit pension plans primarily related to funding requirements of recently acquired companies.
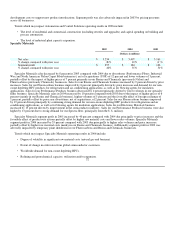
Long-Lived Assets (including Tangible and Definite-Lived Intangible Assets)—To conduct our global business operations and
execute our business strategy, we acquire tangible and intangible assets, including property, plant and equipment and definite-lived
intangible assets. At December 31, 2005, the net carrying amount of these long-lived assets totaled $6,527 million. The determination
of useful lives (for depreciation/amortization purposes) and whether or not these assets are impaired involves the use of accounting
estimates and assumptions which bear the risk of change which could materially impact our financial condition or operating
performance if actual results differ from such estimates and assumptions. We periodically evaluate the recoverability of the carrying
amount of our long-lived assets whenever events or changes in circumstances indicate that the carrying amount of a long-lived asset
group may not be fully recoverable. The principal factors we consider in deciding when to perform an impairment review are as
follows:
• significant under-performance (i.e., declines in sales, earnings or cash flows) of a business or product line in relation to
expectations;
• annual operating plans or five-year strategic plans that indicate an unfavorable trend in operating performance of a business
or product line;
• significant negative industry or economic trends; and
• significant changes or planned changes in our use of the assets.
Once it is determined that an impairment review is necessary, recoverability of assets is measured by comparing the carrying
amount of the asset grouping to the estimated future undiscounted cash flows. If the carrying amount exceeds the estimated future
undiscounted cash flows, the asset grouping is considered to be impaired. The impairment is then measured as the difference between
the carrying amount of the asset grouping and its fair value. We use the best information available to determine fair value, which are
usually either market prices (if available) or an estimate of the future discounted cash
23