Honda 2007 Annual Report Download - page 93
Download and view the complete annual report
Please find page 93 of the 2007 Honda annual report below. You can navigate through the pages in the report by either clicking on the pages listed below, or by using the keyword search tool below to find specific information within the annual report.-
 1
1 -
2
-
3
-
4
-
5
-
6
-
7
-
8
-
9
-
10
-
11
-
12
-
13
-
14
-
15
-
16
-
17
-
18
-
19
-
20
-
21
-
22
-
23
-
24
-
25
-
26
-
27
-
28
-
29
-
30
-
31
-
32
-
33
-
34
-
35
-
36
-
37
-
38
-
39
-
40
-
41
-
42
-
43
-
44
-
45
-
46
-
47
-
48
-
49
-
50
-
51
-
52
-
53
-
54
-
55
-
56
-
57
-
58
-
59
-
60
-
61
-
62
-
63
-
64
-
65
-
66
-
67
-
68
-
69
-
70
-
71
-
72
-
73
-
74
-
75
-
76
-
77
-
78
-
79
-
80
-
81
-
82
-
 83
83 -
 84
84 -
 85
85 -
 86
86 -
 87
87 -
 88
88 -
 89
89 -
 90
90 -
 91
91 -
 92
92 -
 93
93 -
 94
94 -
 95
95 -
 96
96 -
 97
97 -
 98
98 -
 99
99 -
 100
100 -
 101
101 -
 102
102 -
 103
103 -
104
-
105
-
106
-
107
-
108
-
109
-
110
-
111
-
112
-
113
-
114
-
115
-
116
-
117
-
118
-
119
-
120
-
121
-
122
-
123
-
124
-
125
-
126
-
127
-
128
-
129
-
130
-
131
-
132
-
133
-
134
-
135
-
136
 |
 |

91
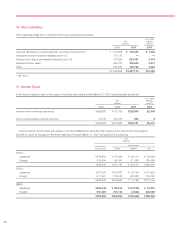
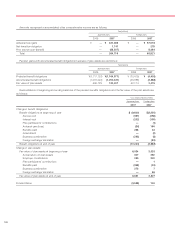
Maturities of debt securities classified as held-to-maturity at March 31, 2007 were as follows:
U.S. dollars
Yen (millions)
(millions) (note 2)
Due within one year ¥03,304 $028
Due after one year through five years 11,035 93
Due after five years through ten years 1,998 17
Total ¥16,337 $138
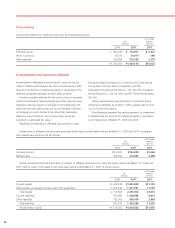
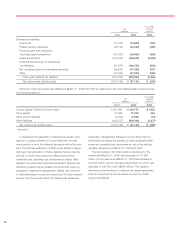
Realized gains and losses from available-for-sale securities
included in other expenses (income)—other for each of the
years in the three-year period ended March 31, 2007, were,
¥2,206 million net gains, ¥462 million net losses and ¥10,463
million ($89 million) net gains, respectively.
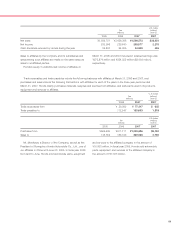
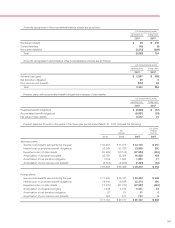
Gross unrealized losses on marketable securities and fair value of the related securities, aggregated by length of time that
individual securities have been in a continuous unrealized loss position at March 31, 2007 were as follows:
U.S. dollars
Yen (millions)
(millions) (note 2)
Unrealized Unrealized
Fair value losses Fair value losses
Available-for-sale
Less than 12 months ¥329 ¥(88) $03$((1)
12 months or longer ————
¥329 ¥(88) $03$((1)
Held-to-maturity
Less than 12 months ¥3,540 ¥0(1) $30 $(0)
12 months or longer 3,938 (14) 33 (0)
¥7,478 ¥(15) $63 $(0)
Honda judged this decline in fair value of investment securi-
ties to be temporary, with considering such factors as finan-
cial and operating conditions of the issuer, the industry in
which the issuer operates, degree and period of the decline
in fair value and other relevant factors.
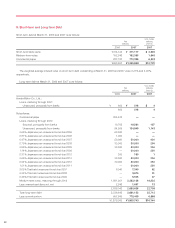
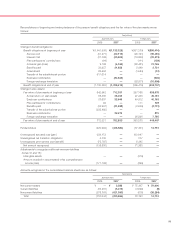
8. Property on Operating Leases
Future minimum lease rentals expected to be received from property on operating leases at March 31, 2007 are as follows:
Ye n
Years ending March 31
(millions)
2008 ¥061,045
2009 60,168
2010 46,470
2011 6,885
2012 112
Total future minimum lease rentals ¥174,680
Future minimum rentals as shown above should not necessarily be considered indicative of future cash collections.