Honda 2007 Annual Report Download - page 56
Download and view the complete annual report
Please find page 56 of the 2007 Honda annual report below. You can navigate through the pages in the report by either clicking on the pages listed below, or by using the keyword search tool below to find specific information within the annual report.-
 1
1 -
2
-
3
-
4
-
5
-
6
-
7
-
8
-
9
-
10
-
11
-
12
-
13
-
14
-
15
-
16
-
17
-
18
-
19
-
20
-
21
-
22
-
23
-
24
-
25
-
26
-
27
-
28
-
29
-
30
-
31
-
32
-
33
-
34
-
35
-
36
-
37
-
38
-
39
-
40
-
41
-
42
-
43
-
44
-
45
-
 46
46 -
 47
47 -
 48
48 -
 49
49 -
 50
50 -
 51
51 -
 52
52 -
 53
53 -
 54
54 -
 55
55 -
 56
56 -
 57
57 -
 58
58 -
 59
59 -
 60
60 -
 61
61 -
 62
62 -
 63
63 -
 64
64 -
 65
65 -
 66
66 -
67
-
68
-
69
-
70
-
71
-
72
-
73
-
74
-
75
-
76
-
77
-
78
-
79
-
80
-
81
-
82
-
83
-
84
-
85
-
86
-
87
-
88
-
89
-
90
-
91
-
92
-
93
-
94
-
95
-
96
-
97
-
98
-
99
-
100
-
101
-
102
-
103
-
104
-
105
-
106
-
107
-
108
-
109
-
110
-
111
-
112
-
113
-
114
-
115
-
116
-
117
-
118
-
119
-
120
-
121
-
122
-
123
-
124
-
125
-
126
-
127
-
128
-
129
-
130
-
131
-
132
-
133
-
134
-
135
-
136
 |
 |

54
Financial Review
03 04 05 06 07
0
2,000
4,000
6,000
8,000
10,000
12,000
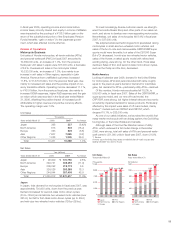
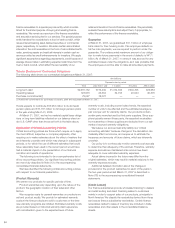
Net Sales and Other Operating
Revenue
Years ended March 31
Yen (billions)
03 04 05 06 07
0
200
400
600
800
0
100
200
300
400
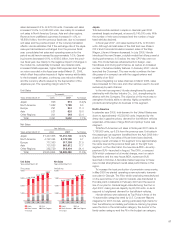
Net Income and Net Income
per Common Share
Years ended March 31
Yen (billions) (Yen)
Net Income (left)
Net Income per Common Share
(right)
Operating and Financial Review
Net Sales and Other Operating Revenue
Honda’s consolidated net sales and other operating revenue
(hereafter, “net sales”) for fiscal year 2007, ended March 31,
2007, grew 11.9%, compared with fiscal year 2006, to
¥11,087.1 billion. Behind this increase were higher unit sales in
the motorcycle business in Other regions, higher overseas unit
sales in the automobile business and higher unit sales in all
regions in power product and other businesses, as well as the
positive impact of currency effects. Honda estimates that if the
exchange rate of the Japanese yen had remained unchanged
from the previous fiscal year, consolidated net sales and
operating revenue for the period would have increased by
approximately 7.4%.
Domestic net sales decreased by 0.8% to ¥1,681.1 billion,
but overseas net sales were up 14.5% from fiscal year 2006,
to ¥9,405.9 billion.
Cost of Sales
Despite the cost reduction effects, the cost of sales rose
12.2%, to ¥7,865.1 billion. The cost of sales was affected by
increased unit sales, substantially increased raw materials
prices, such as steel, aluminum and precious grade metals, as
well as the negative impact of currency effects caused by the
depreciation of the Japanese yen.
Selling, General and Administrative Expenses/Research
and Development Expenses
Selling expenses increased in line with higher unit sales, higher
freight costs as the result of substantially increased crude oil
prices, higher expenses related to product quality and the im-
pact of currency effects. G&A expenses increased due mainly
to the impact of currency effects and the effects from newly
consolidated subsidiaries. Total of SG&A expenses rose 9.8%
from fiscal year 2006, to ¥1,818.2 billion.
R&D expenses also grew 8.1%, to ¥551.8 billion, as we
spent more on safety and environmental technologies and
worked to enhance the attractiveness of our products.
Operating Income
Operating income declined 2.0%, compared with the
preceding year, to ¥851.8 billion. In addition to the above men-
tioned factors, changes in model mix due mainly to shift of cus-
tomers’ demands towards more fuel efficient (compact) models
especially in U.S. market negatively affected operating income.
Other Income and Expenses
Other income and expenses, net, fell ¥20.0 billion, due to an
increase in losses on the valuation of interest rate swaps and
other derivatives.
Income before Income Taxes, Minority Interest and
Equity in Income of Affiliates
Income before income taxes, minority interest and equity in
income of affiliates fell 4.5%, to ¥792.8 billion.
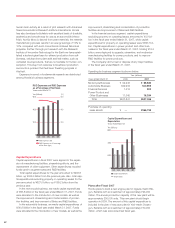
Income Tax Expense
Income tax expense decreased by 10.5%, to ¥283.8 billion.
The effective tax rate was 35.8%, a decrease by 2.4 percent-
age points from the previous fiscal year. Additional detailed in-
formation is described in Note (11) to the accompanying
consolidated financial statements.
Minority Interest in Income of Consolidated
Subsidiaries
The amount deducted for minority interest in income of con-
solidated subsidiaries grew 31.6% from the previous year, to
¥20.1 billion, due mainly to the impact of a newly consolidated
subsidiary.
Equity in Income of Affiliates
Equity in income of affiliates grew 3.8%, to ¥103.4 billion.
Net Income
Net income was down 0.8% from the previous year, to ¥592.3
billion.