Honda 2007 Annual Report Download - page 90
Download and view the complete annual report
Please find page 90 of the 2007 Honda annual report below. You can navigate through the pages in the report by either clicking on the pages listed below, or by using the keyword search tool below to find specific information within the annual report.-
 1
1 -
2
-
3
-
4
-
5
-
6
-
7
-
8
-
9
-
10
-
11
-
12
-
13
-
14
-
15
-
16
-
17
-
18
-
19
-
20
-
21
-
22
-
23
-
24
-
25
-
26
-
27
-
28
-
29
-
30
-
31
-
32
-
33
-
34
-
35
-
36
-
37
-
38
-
39
-
40
-
41
-
42
-
43
-
44
-
45
-
46
-
47
-
48
-
49
-
50
-
51
-
52
-
53
-
54
-
55
-
56
-
57
-
58
-
59
-
60
-
61
-
62
-
63
-
64
-
65
-
66
-
67
-
68
-
69
-
70
-
71
-
72
-
73
-
74
-
75
-
76
-
77
-
78
-
79
-
 80
80 -
 81
81 -
 82
82 -
 83
83 -
 84
84 -
 85
85 -
 86
86 -
 87
87 -
 88
88 -
 89
89 -
 90
90 -
 91
91 -
 92
92 -
 93
93 -
 94
94 -
 95
95 -
 96
96 -
 97
97 -
 98
98 -
 99
99 -
 100
100 -
101
-
102
-
103
-
104
-
105
-
106
-
107
-
108
-
109
-
110
-
111
-
112
-
113
-
114
-
115
-
116
-
117
-
118
-
119
-
120
-
121
-
122
-
123
-
124
-
125
-
126
-
127
-
128
-
129
-
130
-
131
-
132
-
133
-
134
-
135
-
136
 |
 |
88
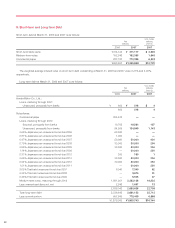
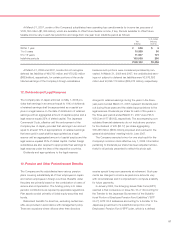
5. Inventories
Inventories at March 31, 2006 and 2007 are summarized as follows:
U.S. dollars
Yen (millions)
(millions) (note 2)
2006 2007 2007
Finished goods ¥0,687,230 ¥0,772,917 $06,547
Work in process 28,218 34,970 296
Raw materials 320,856 375,229 3,179
¥1,036,304 ¥1,183,116 $10,022
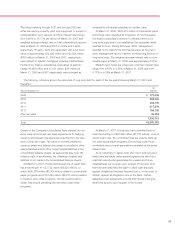
6. Investments and Advances-Affiliates
Investments in affiliates are accounted for using the equity
method. Differences between the cost of investments in affili-
ates and the amount of underlying equity in net assets of the
affiliates principally represent investor level goodwill.
Honda considers whether the fair value of any of its equity
method investments have declined below their carrying value
whenever adverse events or changes in circumstances indi-
cate that recorded values may not be recoverable. If Honda
considered any such decline to be other than temporary
based on various factors, then a write-down would be
recorded to estimated fair value.
Significant investments in affiliates accounted for under
the equity method at March 31, 2006 and 2007 are Showa
Corporation (33.5%), Keihin Corporation (42.2%),
Guangzhou Honda Automobile Co., Ltd. (50.0%), Dongfeng
Honda Engine Co., Ltd. (50.0%), and P.T. Astra Honda Motor
(50.0%).
Certain adjustments were recorded to investments and
advances to affiliates as of April 1, 2006, please refer to note
1(u) for further information.
The difference between the carrying amount of investment
in affiliates and the amount of underlying equity in net assets
is not material as of March 31, 2006 and 2007.
Investments in affiliates include equity securities which have quoted market values at March 31, 2006 and 2007 compared
with related carrying amounts as follows:
U.S. dollars
Yen (millions)
(millions) (note 2)
2006 2007 2007
Carrying amount ¥130,802 ¥184,879 $1,566
Market value 444,250 412,892 3,498
Certain combined financial information in respect of affiliates accounted for under the equity method at March 31, 2006 and
2007, and for each of the years in the three-year period ended March 31, 2007 is shown below:
U.S. dollars
Yen (millions)
(millions) (note 2)
2006 2007 2007
Current assets ¥1,056,428 ¥1,434,855 $12,155
Other assets, principally property, plant and equipment 1,063,235 1,317,057 11,157
Total assets 2,119,663 2,751,912 23,312
Current liabilities 762,660 1,038,968 8,801
Other liabilities 182,503 306,418 2,596
Total liabilities 945,163 1,345,386 11,397
Stockholders’ equity ¥1,174,500 ¥1,406,526 $11,915