Honda 2007 Annual Report Download - page 59
Download and view the complete annual report
Please find page 59 of the 2007 Honda annual report below. You can navigate through the pages in the report by either clicking on the pages listed below, or by using the keyword search tool below to find specific information within the annual report.-
 1
1 -
2
-
3
-
4
-
5
-
6
-
7
-
8
-
9
-
10
-
11
-
12
-
13
-
14
-
15
-
16
-
17
-
18
-
19
-
20
-
21
-
22
-
23
-
24
-
25
-
26
-
27
-
28
-
29
-
30
-
31
-
32
-
33
-
34
-
35
-
36
-
37
-
38
-
39
-
40
-
41
-
42
-
43
-
44
-
45
-
46
-
47
-
48
-
 49
49 -
 50
50 -
 51
51 -
 52
52 -
 53
53 -
 54
54 -
 55
55 -
 56
56 -
 57
57 -
 58
58 -
 59
59 -
 60
60 -
 61
61 -
 62
62 -
 63
63 -
 64
64 -
 65
65 -
 66
66 -
 67
67 -
 68
68 -
 69
69 -
70
-
71
-
72
-
73
-
74
-
75
-
76
-
77
-
78
-
79
-
80
-
81
-
82
-
83
-
84
-
85
-
86
-
87
-
88
-
89
-
90
-
91
-
92
-
93
-
94
-
95
-
96
-
97
-
98
-
99
-
100
-
101
-
102
-
103
-
104
-
105
-
106
-
107
-
108
-
109
-
110
-
111
-
112
-
113
-
114
-
115
-
116
-
117
-
118
-
119
-
120
-
121
-
122
-
123
-
124
-
125
-
126
-
127
-
128
-
129
-
130
-
131
-
132
-
133
-
134
-
135
-
136
 |
 |

57
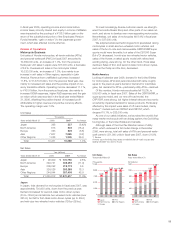
sales decreased 3.4%, to 672,000 units. Overseas unit sales
increased 10.6%, to 2,980,000 units, due mainly to increased
unit sales in North America, Europe, Asia and other regions.
Revenue from unaffiliated customers increased 11.0%, to
¥8,889.0 billion, from the previous fiscal year, due to increased
unit sales and the positive impact of the currency translation
effects. Honda estimates that if the exchange rate of the Japa-
nese yen had remained unchanged from the previous fiscal
year, consolidated net sales and operating revenue for the
period would have increased by approximately 7.0%. Operat-
ing income decreased 4.6%, to ¥599.5 billion, from the previ-
ous fiscal year, due mainly to the negative impact of changes in
the model mix, substantially increased raw material costs,
increased SG&A expenses, higher R&D expenses and the gain
on return recorded in the fiscal year ended March 31, 2006,
which offset the positive impacts of higher revenue attributable
to the increased unit sales, continuing cost reduction effects
and the currency effects caused by the depreciation of the
Japanese yen. The operating margin was 6.7%.
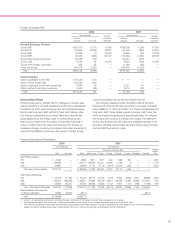
Unit Sales
Thousands
Years ended March 31 2006 2007 % change
Japan 696 672 (3.4)%
North America 1,682 1,788 6.3
Europe 291 324 11.3
Asia 521 620 19.0
Other Regions 201 248 23.4
Total 3,391 3,652 7.7%
Net Sales
Yen (millions)
Years ended March 31 2006 2007 % change
Japan ¥1,447,388 ¥1,412,726 (2.4)%
North America 4,722,354 5,179,139 9.7
Europe 717,360 917,199 27.9
Asia 731,833 861,612 17.7
Other Regions 385,759 518,404 34.4
Total ¥8,004,694 ¥8,889,080 11.0%
Japan
Total automobile demand in Japan in calendar year 2006
remained largely unchanged, at around 5,740,000 units. With
the number of mini-cars increased and the number of regis-
tered vehicles declined.
In fiscal year 2007, unit sales declined 3.4%, to 672,000
units. Although Honda’s sales of the Zest and new Stream,
CR-V and Crossroad models increased, sales of the Step
Wagon, Life and Airwave decreased. In July 2006, Honda
introduced the new Stream, a stylish model that offers powerful
driving performance. In October, the new CR-V also went on
sale. This model features advancements in design, user-
friendliness and driving performance, as well as an increased
number of advanced safety features. In February 2007, Honda
launched the Crossroad. This new model combines the han-
dling ease of a compact car with the rugged exterior and
versatility of an SUV.
Since integrating our sales channels in March 2006, sales
have increased for mini-cars and other vehicles used to be sold
exclusively by each channel.
In the mini-car segment, Honda strengthened its capital
relationship with Yachiyo Industry Co., Ltd., strengthening its
alliance with the Company. The objective of this move was to
strengthen Honda’s ability to develop highly competitive
products and strengthen its business in this segment.
North America
In calendar year 2006, total demand in the United States was
down to approximately 16,550,000 units. Impacted by the
sharp rise in gasoline prices, demand for fuel-efficient vehicles
expanded, while sales of large SUVs and pickup trucks was
stagnant.
Total North American unit sales in fiscal year 2007 came to
1,788,000 units, up 6.3% from the previous year. Unit sales in
the passenger car segment benefited from the April 2006 intro-
duction of the Fit, but sales of Acura-brand cars declined,
causing overall unit sales in this segment to be approximately
the same level as the previous fiscal year. In the light truck
segment, on the other hand, the new Acura RDX—an entry-
premium SUV—launched in August. The CR-V, a compact
SUV which underwent a full model change, went on sale in
September, and the new Acura MDX, a premium SUV,
launched in October. A favorable market response to these
new models strengthened overall sales performance in this
region.
To increase the local production of powertrain components,
in May 2006 we started operating a new automatic transmis-
sion plant in Georgia. The Pilot, which was being manufactured
on the second line of our plant in Canada, was transferred to
Honda’s plant in Alabama in February 2007 and the second
line of our plant in Canada began manufacturing the Civic in
April 2007, raising annual capacity by 60,000 units, so as to
respond to heightened demand for fuel-efficient vehicles.
Honda vehicles were selected as Top Picks in three of the
10 automobile categories rated by U.S. Consumer Reports
magazine for 2007 models, earning particularly high marks for
their fuel efficiency and safety performance. Earning top place
were the Civic in the small sedan category, the Accord in the
family sedan category and the Fit in the budget car category.
03 04 05 06 07 03 04 05 06 07
4,000
2,000
3,000
1,000
2,888
6,440
2,983
3,242
6,592 6,963
0
10,000
7,500
5,000
2,500
0
3,391
3,652
8,004 8,889
Unit Sales
Y
ears ended March 31
(Thousands)
Net Sales
Years ended March 31
Yen (billions)
Japan
North America
Europe
Asia
Other Regions
Japan
North America
Europe
Asia
Other Regions