Honda 2007 Annual Report Download - page 77
Download and view the complete annual report
Please find page 77 of the 2007 Honda annual report below. You can navigate through the pages in the report by either clicking on the pages listed below, or by using the keyword search tool below to find specific information within the annual report.-
 1
1 -
2
-
3
-
4
-
5
-
6
-
7
-
8
-
9
-
10
-
11
-
12
-
13
-
14
-
15
-
16
-
17
-
18
-
19
-
20
-
21
-
22
-
23
-
24
-
25
-
26
-
27
-
28
-
29
-
30
-
31
-
32
-
33
-
34
-
35
-
36
-
37
-
38
-
39
-
40
-
41
-
42
-
43
-
44
-
45
-
46
-
47
-
48
-
49
-
50
-
51
-
52
-
53
-
54
-
55
-
56
-
57
-
58
-
59
-
60
-
61
-
62
-
63
-
64
-
65
-
66
-
 67
67 -
 68
68 -
 69
69 -
 70
70 -
 71
71 -
 72
72 -
 73
73 -
 74
74 -
 75
75 -
 76
76 -
 77
77 -
 78
78 -
 79
79 -
 80
80 -
 81
81 -
 82
82 -
 83
83 -
 84
84 -
 85
85 -
 86
86 -
 87
87 -
88
-
89
-
90
-
91
-
92
-
93
-
94
-
95
-
96
-
97
-
98
-
99
-
100
-
101
-
102
-
103
-
104
-
105
-
106
-
107
-
108
-
109
-
110
-
111
-
112
-
113
-
114
-
115
-
116
-
117
-
118
-
119
-
120
-
121
-
122
-
123
-
124
-
125
-
126
-
127
-
128
-
129
-
130
-
131
-
132
-
133
-
134
-
135
-
136
 |
 |

75
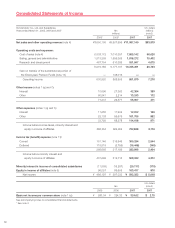
Consolidated Statements of Cash Flows
Honda Motor Co., Ltd. and Subsidiaries
U.S. dollars
Years ended March 31, 2005, 2006 and 2007
Yen (millions)
(millions) (note 2)
2005* 2006* 2007 2007
Cash flows from operating activities (note 14):
Net income ¥0,486,197 ¥0,597,033 ¥0,592,322 $05,018
Adjustments to reconcile net income to net cash provided
by operating activities:
Depreciation excluding property on operating leases 225,752 262,225 361,747 3,064
Depreciation of property on operating leases — — 9,741 83
Deferred income taxes 115,519 (2,756) (16,448) (139)
Minority interest in income 11,559 15,287 20,117 170
Equity in income of affiliates (96,057) (99,605) (103,417) (876)
Dividends from affiliates 35,824 64,055 54,849 465
Provision for credit and lease residual losses on finance
subsidiaries–receivables 50,638 36,153 44,128 374
Loss (gain) on derivative instruments, net (60,432) 10,351 56,836 481
Gain on transfer of the substitutional portion of
the Employees’ Pension Funds (note 13) — (138,016) ——
Decrease (increase) in assets:
Trade accounts and notes receivable (70,145) (113,259) (49,529) (420)
Inventories (79,483) (109,661) (96,839) (820)
Other current assets 10,280 (59,484) (15,206) (129)
Other assets (78,130) (81,796) (5,523) (47)
Increase (decrease) in liabilities:
Trade accounts and notes payable 66,488 21,420 38,186 323
Accrued expenses 41,101 51,653 41,898 355
Income taxes payable 33,704 39,900 (37,282) (316)
Other current liabilities 19,973 6,126 1,103 9
Other liabilities 66,621 80,410 14,274 121
Other, net 5,761 604 (6,432) (54)
Net cash provided by operating activities 785,170 580,640 904,525 7,662
Cash flows from investing activities:
Increase in investments and advances (25,661) (17,314) (9,874) (84)
Decrease in investments and advances 15,985 3,711 3,829 32
Payment for purchase of available-for-sale securities (96,829) (158,011) (141,902) (1,202)
Proceeds from sales of available-for-sale securities 154,253 129,496 172,806 1,464
Payment for purchase of held-to-maturity securities (20,856) (63,395) (13,614) (115)
Proceeds from redemption of held-to-maturity securities — 55,990 41,109 348
Capital expenditures (373,980) (460,021) (597,958) (5,065)
Proceeds from sales of property, plant and equipment 14,216 39,951 20,641 175
Acquisitions of finance subsidiaries–receivables (2,710,520) (3,031,644) (2,857,024) (24,202)
Collections of finance subsidiaries–receivables 1,561,299 1,870,675 2,138,875 18,118
Proceeds from sales of finance subsidiaries–receivables 684,308 930,595 477,927 4,049
Purchase of operating lease assets — — (366,795) (3,107)
Proceeds from sales of operating lease assets — — 1,276 11
Net cash used in investing activities (797,785) (699,967) (1,130,704) (9,578)
Cash flows from financing activities:
Increase (decrease) in short-term debt, net 20,244 (124,941) 306,063 2,593
Proceeds from long-term debt 704,433 865,677 969,491 8,213
Repayment of long-term debt (495,238) (568,605) (677,539) (5,740)
Cash dividends paid (note 12) (47,797) (71,061) (140,482) (1,190)
Cash dividends paid to minority interests (2,722) (4,083) (7,434) (63)
Payment for purchase of treasury stock, net (84,147) (77,064) (26,689) (226)
Net cash provided by financing activities 94,773 19,923 423,410 3,587
Effect of exchange rate changes on cash and cash equivalents 12,394 43,406 31,527 267
Net change in cash and cash equivalents 94,552 (55,998) 228,758 1,938
Cash and cash equivalents at beginning of year* 678,234 772,786 716,788 6,072
Cash and cash equivalents at end of year ¥0,772,786 ¥0,716,788 ¥0,945,546 $08,010
See accompanying notes to consolidated financial statements.
* See note 3.