Honda 2007 Annual Report Download - page 123
Download and view the complete annual report
Please find page 123 of the 2007 Honda annual report below. You can navigate through the pages in the report by either clicking on the pages listed below, or by using the keyword search tool below to find specific information within the annual report.-
 1
1 -
2
-
3
-
4
-
5
-
6
-
7
-
8
-
9
-
10
-
11
-
12
-
13
-
14
-
15
-
16
-
17
-
18
-
19
-
20
-
21
-
22
-
23
-
24
-
25
-
26
-
27
-
28
-
29
-
30
-
31
-
32
-
33
-
34
-
35
-
36
-
37
-
38
-
39
-
40
-
41
-
42
-
43
-
44
-
45
-
46
-
47
-
48
-
49
-
50
-
51
-
52
-
53
-
54
-
55
-
56
-
57
-
58
-
59
-
60
-
61
-
62
-
63
-
64
-
65
-
66
-
67
-
68
-
69
-
70
-
71
-
72
-
73
-
74
-
75
-
76
-
77
-
78
-
79
-
80
-
81
-
82
-
83
-
84
-
85
-
86
-
87
-
88
-
89
-
90
-
91
-
92
-
93
-
94
-
95
-
96
-
97
-
98
-
99
-
100
-
101
-
102
-
103
-
104
-
105
-
106
-
107
-
108
-
109
-
110
-
111
-
112
-
 113
113 -
 114
114 -
 115
115 -
 116
116 -
 117
117 -
 118
118 -
 119
119 -
 120
120 -
 121
121 -
 122
122 -
 123
123 -
 124
124 -
 125
125 -
 126
126 -
 127
127 -
 128
128 -
 129
129 -
 130
130 -
 131
131 -
 132
132 -
 133
133 -
134
-
135
-
136
 |
 |

121
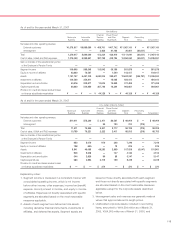
Selected Quarterly Financial Data (Unaudited and Not Reviewed)
Yen (millions except per share amounts)
Year ended March 31, 2006 Year ended March 31, 2007
I II III IV I II III IV
Net sales and
other operating revenue ¥2,264,579 ¥2,337,670 ¥2,472,006 ¥2,833,741 ¥2,599,724 ¥2,630,874 ¥2,768,652 ¥3,087,890
Operating income 170,393 162,694 194,986 340,832 203,521 193,024 205,110 250,224
Income before income taxes 148,042 173,245 170,000 338,617 191,365 163,643 198,785 239,075
Net income 110,666 133,708 133,146 219,513 143,402 127,909 144,827 176,184
Basic net income per
American depositary share
¥59.87 ¥72.45 ¥72.41 ¥119.89 ¥78.46 ¥70.05 ¥79.45 ¥96.70
Tokyo Stock Exchange:
(TSE) (in yen)
High ¥2,835 ¥3,310 ¥3,570 ¥3,750 ¥4,285 ¥4,030 ¥4,740 ¥4,940
Low 2,510 2,690 3,070 3,050 3,270 3,410 3,910 4,050
New York Stock Exchange:
(NYSE) (in U.S. dollars)
High $26.00 $29.08 $29.70 $31.74 $37.95 $35.00 $39.87 $40.82
Low 23.75 24.06 26.50 27.10 29.13 29.43 33.49 34.64
*1 All quarterly financial data is unaudited and has not been reviewed by the independent registered public accounting firm (KPMG AZSA & Co.).
*2 Certain revisions for misclassifications and reclassifications have been made to the prior years’ consolidated financial statements to conform to the
presentation used for the fiscal year ended March 31, 2007. Detailed information is described in note 3.
*3 The Company executed a two-for-one stock split for the Company’s common stock effective July 1, 2006. All per share information has been adjusted
retroactively for all periods presented to reflect this stock split. The prices of shares on the Tokyo Stock Exchange prior to the split have been
retroactively for consistency. Consequently, the prices shown here are not the actual prices of shares on the Tokyo Stock Exchange.