Honda 2007 Annual Report Download - page 4
Download and view the complete annual report
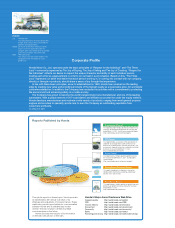
Please find page 4 of the 2007 Honda annual report below. You can navigate through the pages in the report by either clicking on the pages listed below, or by using the keyword search tool below to find specific information within the annual report.-
 1
1 -
 2
2 -
 3
3 -
 4
4 -
 5
5 -
 6
6 -
 7
7 -
 8
8 -
 9
9 -
 10
10 -
 11
11 -
 12
12 -
 13
13 -
 14
14 -
 15
15 -
16
-
17
-
18
-
19
-
20
-
21
-
22
-
23
-
24
-
25
-
26
-
27
-
28
-
29
-
30
-
31
-
32
-
33
-
34
-
35
-
36
-
37
-
38
-
39
-
40
-
41
-
42
-
43
-
44
-
45
-
46
-
47
-
48
-
49
-
50
-
51
-
52
-
53
-
54
-
55
-
56
-
57
-
58
-
59
-
60
-
61
-
62
-
63
-
64
-
65
-
66
-
67
-
68
-
69
-
70
-
71
-
72
-
73
-
74
-
75
-
76
-
77
-
78
-
79
-
80
-
81
-
82
-
83
-
84
-
85
-
86
-
87
-
88
-
89
-
90
-
91
-
92
-
93
-
94
-
95
-
96
-
97
-
98
-
99
-
100
-
101
-
102
-
103
-
104
-
105
-
106
-
107
-
108
-
109
-
110
-
111
-
112
-
113
-
114
-
115
-
116
-
117
-
118
-
119
-
120
-
121
-
122
-
123
-
124
-
125
-
126
-
127
-
128
-
129
-
130
-
131
-
132
-
133
-
134
-
135
-
136
 |
 |

Financial Data
Honda Motor Co., Ltd., and Subsidiaries
Years ended or at March 31
U.S. dollars
Yen (millions except
(millions except per share data) per share data)
2005 2006 2007 2007
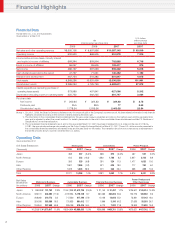
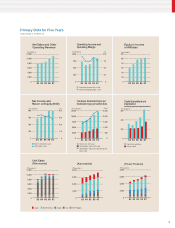
Net sales and other operating revenue ¥8,650,105 ¥ 9,907,996 ¥11,087,140 $ 93,919
Operating income 630,920 868,905 851,879 7,216
Income before income taxes, minority interest
and equity in income of affiliates 668,364 829,904 792,868 6,716
Equity in income of affiliates 96,057 99,605 103,417 876
Net income 486,197 597,033 592,322 5,018
Cash dividends paid during the period 47,797 71,061 140,482 1,190
Research and development 467,754.510,385 551,847 4,675
Total assets 9,368,236 10,631,400 12,036,500 101,961
Stockholders’ equity 3,289,294 4,125,750 4,482,611 37,972
Capital expenditures
(excluding purchase of
operating lease assets)
373,980 457,841 627,066 5,312
Depreciation
(excluding property on operating leases)
225,752 262,225 361,747 3,064
Per share data
Net income ¥ 260.34.¥ 324.33.¥ 324.62.$ 2.75.
Dividends paid 25.5.38.5.77.0.65.
Stockholders’ equity 1,778.24.2,259.26.2,460.28.20.84.
(Notes) 1. On July 1, 2006, the Board of Directors declared a two-for-one stock split of the Company’s common stock. All share-related information in this financial
highlights are stated according to the number of shares following the stock split.
2. The information in the consolidated financial statements for the year under review is presented according to the method used until the preceding fiscal
year, and is adjusted to reflect the current method. For details, please refer to the note to the consolidated financial statements entitled “3. Revisions of
Classifications” in the financial section.
3. The consolidated financial statements as of and for the year ended March 31, 2007 have been translated into U.S. dollars at the rate of ¥118.05=
U.S.$1, the approximate exchange rate prevailing on the Tokyo Foreign Exchange Market on March 31, 2007. Those U.S. dollar amounts presented in
the consolidated financial statements and related notes are included solely for the reader. This translation should not be construed as a representation
that all the amounts shown could be converted into U.S. dollars.
Operating Data
Years ended March 31
Unit Sales Breakdown Motorcycles Automobiles Power Products
(Thousands) 2006 2007 Change 2006 2007 Change 2006 2007 Change
Japan
368 337 (8.4)% 696 672 (3.4)% 487 527 8.2%
North America
615 503 (18.2) 1,682 1,788 6.3 2,827 3,103 9.8%
Europe
353 329 (6.8) 291 324 11.3 1,477 1,625 10.0%
Asia
7,907 7,895 (0.2) 521 620 19.0 717 760 6.0%
Other Regions
1,028 1,305 26.9 201 248 23.4 368 406 10.3%
Total
10,271 10,369 1.0% 3,391 3,652 7.7% 5,876 6,421 9.3%
Net Sales Power Product and
Breakdown Motorcycle Business Automobile Business Financial Services Business Other Businesses
Yen (millions) 2006 2007 Change 2006 2007 Change 2006 2007 Change 2006 2007 Change
Japan
¥ 99,009 ¥ 101,753 2.8% ¥1,447,388 ¥1,412,726 (2.4)% ¥ 21,140 ¥ 21,497 1.7% ¥126,507 ¥145,214 14.8%
North America
349,741 308,293 (11.9) 4,722,354 5,179,139 9.7 267,485 364,892 36.4%123,779 128,552 3.9%
Europe
208,092 219,773 5.6 717,360 917,199 27.9 10,108 12,642 25.1%73,861 87,143 18.0%
Asia
324,026 383,389 18.3 731,833 861,612 17.7 1,966 3,150 60.2%27,626 35,003 26.7%
Other Regions
244,944 357,409 45.9 385,759 518,404 34.4 6,170 7,520 21.9%18,848 21,830 15.8%
Total
¥1,225,812 ¥1,370,617 11.8% ¥8,004,694 ¥8,889,080 11.0% ¥306,869 ¥409,701 33.5% ¥370,621 ¥417,742 12.7%
2
Financial Highlights