Honda 2007 Annual Report Download - page 87
Download and view the complete annual report
Please find page 87 of the 2007 Honda annual report below. You can navigate through the pages in the report by either clicking on the pages listed below, or by using the keyword search tool below to find specific information within the annual report.-
 1
1 -
2
-
3
-
4
-
5
-
6
-
7
-
8
-
9
-
10
-
11
-
12
-
13
-
14
-
15
-
16
-
17
-
18
-
19
-
20
-
21
-
22
-
23
-
24
-
25
-
26
-
27
-
28
-
29
-
30
-
31
-
32
-
33
-
34
-
35
-
36
-
37
-
38
-
39
-
40
-
41
-
42
-
43
-
44
-
45
-
46
-
47
-
48
-
49
-
50
-
51
-
52
-
53
-
54
-
55
-
56
-
57
-
58
-
59
-
60
-
61
-
62
-
63
-
64
-
65
-
66
-
67
-
68
-
69
-
70
-
71
-
72
-
73
-
74
-
75
-
76
-
 77
77 -
 78
78 -
 79
79 -
 80
80 -
 81
81 -
 82
82 -
 83
83 -
 84
84 -
 85
85 -
 86
86 -
 87
87 -
 88
88 -
 89
89 -
 90
90 -
 91
91 -
 92
92 -
 93
93 -
 94
94 -
 95
95 -
 96
96 -
 97
97 -
98
-
99
-
100
-
101
-
102
-
103
-
104
-
105
-
106
-
107
-
108
-
109
-
110
-
111
-
112
-
113
-
114
-
115
-
116
-
117
-
118
-
119
-
120
-
121
-
122
-
123
-
124
-
125
-
126
-
127
-
128
-
129
-
130
-
131
-
132
-
133
-
134
-
135
-
136
 |
 |

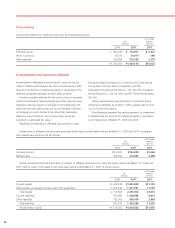
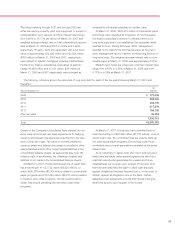
85
Yen (millions)
2005 2005
Previously After
reported (a) (b) (d) (e) Total revised
Cash flows from operating activities
Adjustments to reconcile net income to
net cash provided by operating activities:
Minority interest in income — 11,559 11,559 11,559
Decrease (increase) in assets:
Other current assets (11,797) 14,332 7,745 22,077 10,280
Other assets (52,198) (14,332) (11,600) (25,932) (78,130)
Increase (decrease) in liabilities:
Trade accounts and notes payable 76,338 (9,850) (9,850) 66,488
Accrued expenses 71,469 (26,239) (4,129) (30,368) 41,101
Other liabilities 19,826 2,722 26,239 17,834 46,795 66,621
Other, net 17,320 (11,559) (11,559) 5,761
Net cash provided by operating activities 782,448 2,722 — — — 2,722 785,170
Cash flows from investing activities:
Payment for purchase of available-for-sale securities (1,608) (95,221) (95,221) (96,829)
Proceeds from sales of available-for-sale securities 13,140 141,113 141,113 154,253
Net cash used in investing activities (843,677) — 45,892 — — 45,892 (797,785)
Cash flows from financing activities:
Cash dividends paid to minority interests — (2,722) (2,722) (2,722)
Net cash provided by financing activities 97,495 (2,722) — — — (2,722) 94,773
Effect of exchange rate changes on
cash and cash equivalents 12,851 (457) (457) 12,394
Net change in cash and cash equivalents 49,117 — 45,435 — — 45,435 94,552
Cash and cash equivalents at beginning of year 724,421 (46,187) (46,187) 678,234
Cash and cash equivalents at end of year 773,538 — (752) — — (752) 772,786
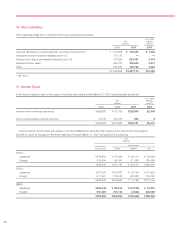
4. Finance Subsidiaries–Receivables and Securitizations
Finance subsidiaries-receivables represent finance receiv-
ables generated by finance subsidiaries. Certain finance
receivables related to sales of inventory are included in trade
receivables and other assets in the consolidated balance
sheets. Finance receivables include wholesale financing to
dealers and retail financing and direct financing leases to
consumers.
The allowance for credit losses is maintained at an
amount management deems adequate to cover estimated
losses on finance receivables. The allowance is based on
management’s evaluation of many factors, including current
economic trends, industry experience, inherent risks in the
portfolio and the borrower’s ability to pay.
Finance subsidiaries of the Company purchase insurance
to cover a substantial amount of the estimated residual value
of vehicles leased to customers. The allowance for losses on
lease residual values is maintained at an amount manage-
ment deems adequate to cover estimated losses on the
uninsured portion of the vehicles’ lease residual values. The
allowance is also based on management’s evaluation of
many factors, including current economic conditions,
industry experience and the finance subsidiaries’ historical
experience with residual value losses.