Honda 2007 Annual Report Download - page 85
Download and view the complete annual report
Please find page 85 of the 2007 Honda annual report below. You can navigate through the pages in the report by either clicking on the pages listed below, or by using the keyword search tool below to find specific information within the annual report.-
 1
1 -
2
-
3
-
4
-
5
-
6
-
7
-
8
-
9
-
10
-
11
-
12
-
13
-
14
-
15
-
16
-
17
-
18
-
19
-
20
-
21
-
22
-
23
-
24
-
25
-
26
-
27
-
28
-
29
-
30
-
31
-
32
-
33
-
34
-
35
-
36
-
37
-
38
-
39
-
40
-
41
-
42
-
43
-
44
-
45
-
46
-
47
-
48
-
49
-
50
-
51
-
52
-
53
-
54
-
55
-
56
-
57
-
58
-
59
-
60
-
61
-
62
-
63
-
64
-
65
-
66
-
67
-
68
-
69
-
70
-
71
-
72
-
73
-
74
-
 75
75 -
 76
76 -
 77
77 -
 78
78 -
 79
79 -
 80
80 -
 81
81 -
 82
82 -
 83
83 -
 84
84 -
 85
85 -
 86
86 -
 87
87 -
 88
88 -
 89
89 -
 90
90 -
 91
91 -
 92
92 -
 93
93 -
 94
94 -
 95
95 -
96
-
97
-
98
-
99
-
100
-
101
-
102
-
103
-
104
-
105
-
106
-
107
-
108
-
109
-
110
-
111
-
112
-
113
-
114
-
115
-
116
-
117
-
118
-
119
-
120
-
121
-
122
-
123
-
124
-
125
-
126
-
127
-
128
-
129
-
130
-
131
-
132
-
133
-
134
-
135
-
136
 |
 |

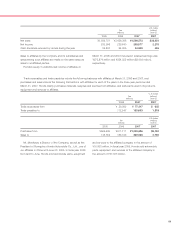
83
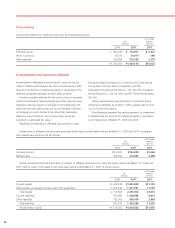
The impact of the affected line items in the consolidated balance sheet at March 31, 2006 and in the consolidated state-
ments of income and the consolidated statements of cash flows for the years ended March 31, 2005 and 2006 are as follows:
Consolidated Balance Sheet
Yen (millions)
2006 2006
Previously After
Assets reported (a) (b) (c) (d) (e) (f) Total revised
Cash and cash equivalents 747,327 (30,539) (30,539) 716,788
Deferred income taxes 198,033 80,859 (33,845) (23,753) 23,261 221,294
Other current assets 450,002 30,539 (22,097) (51,459) (43,017) 406,985
Total current assets 4,625,898 — — 80,859 (55,942) (75,212) — (50,295) 4,575,603
Investments and advances:
Other, including marketable
equity securities 286,092 12,368 12,368 298,460
Total investments and advances 695,085 — — — — — 12,368 12,368 707,453
Other assets 453,006 22,097 87,917 (12,368) 97,646 550,652
Total assets 10,571,681 — — 80,859 (33,845) 12,705 — 59,719 10,631,400
Yen (millions)
2006 2006
Liailities, Minority Interests Previously After
and Stockholders’ Equity reported (a) (b) (c) (d) (e) (f) Total revised
Trade payables:
Accounts 1,099,902 (84,493) (84,493) 1,015,409
Accrued expenses 930,115 (105,605) (37,538) (143,143) 786,972
Other current liabilities 466,332 (268,106) (268,106) 198,226
Total current liabilities 3,989,409 — — (268,106) (105,605) (122,031) — (495,742) 3,493,667
Other liabilities 577,522 (87,460) 348,965 71,760 134,736 468,001 1,045,523
Total liabilities 6,445,931 (87,460) — 80,859 (33,845) 12,705 — (27,741) 6,418,190
Minority interests in
consolidated subsidiaries — 87,460 87,460 87,460
Total liabilities, minority interests
and stockholders’ equity 10,571,681 — — 80,859 (33,845) 12,705 — 59,719 10,631,400
Consolidated Statements of Income
Yen (millions)
2006 2006
Previously After
reported (a) revised
Income before income taxes, minority interest and equity in income of affiliates 814,617 15,287 829,904
Income before minority interest and equity in income of affiliates 497,428 15,287 512,715
Minority interest in income of consolidated subsidiaries — (15,287) (15,287)
Net income 597,033 — 597,033
Yen (millions)
2005 2005
Previously After
reported (a) revised
Income before income taxes, minority interest and equity in income of affiliates 656,805 11,559 668,364
Income before minority interest and equity in income of affiliates 390,140 11,559 401,699
Minority interest in income of consolidated subsidiaries — (11,559) (11,559)
Net income 486,197 — 486,197