Honda 2007 Annual Report Download - page 69
Download and view the complete annual report
Please find page 69 of the 2007 Honda annual report below. You can navigate through the pages in the report by either clicking on the pages listed below, or by using the keyword search tool below to find specific information within the annual report.-
 1
1 -
2
-
3
-
4
-
5
-
6
-
7
-
8
-
9
-
10
-
11
-
12
-
13
-
14
-
15
-
16
-
17
-
18
-
19
-
20
-
21
-
22
-
23
-
24
-
25
-
26
-
27
-
28
-
29
-
30
-
31
-
32
-
33
-
34
-
35
-
36
-
37
-
38
-
39
-
40
-
41
-
42
-
43
-
44
-
45
-
46
-
47
-
48
-
49
-
50
-
51
-
52
-
53
-
54
-
55
-
56
-
57
-
58
-
 59
59 -
 60
60 -
 61
61 -
 62
62 -
 63
63 -
 64
64 -
 65
65 -
 66
66 -
 67
67 -
 68
68 -
 69
69 -
 70
70 -
 71
71 -
 72
72 -
 73
73 -
 74
74 -
 75
75 -
 76
76 -
 77
77 -
 78
78 -
 79
79 -
80
-
81
-
82
-
83
-
84
-
85
-
86
-
87
-
88
-
89
-
90
-
91
-
92
-
93
-
94
-
95
-
96
-
97
-
98
-
99
-
100
-
101
-
102
-
103
-
104
-
105
-
106
-
107
-
108
-
109
-
110
-
111
-
112
-
113
-
114
-
115
-
116
-
117
-
118
-
119
-
120
-
121
-
122
-
123
-
124
-
125
-
126
-
127
-
128
-
129
-
130
-
131
-
132
-
133
-
134
-
135
-
136
 |
 |

67
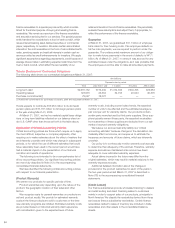
(Interest Rate Risks)
Honda is exposed to market risk for changes in interest rates
related primarily to its debt obligations and finance receivables.
In addition to short-term financing such as commercial paper,
Honda has long-term debt with both fixed and floating rates.
Our finance receivables are primarily fixed rate. Interest rate
swap agreements are mainly used to convert floating rate
financing (normally three-five years) to fixed rate financing in
order to match financing costs with income from finance re-
ceivables. Foreign currency and interest rate swap agreements
used among different currencies, also serve to hedge foreign
currency exchange risk as well as interest rate risk.
The following tables provide information about Honda’s
financial instruments that were sensitive to changes in interest
rates at March 31, 2006 and 2007. For finance receivables and
long-term debt, these tables present principal cash flows, fair
value and related weighted average interest rates. For interest
rate swaps and currency & interest rate swaps, the table pre-
sents notional amounts, fair value and weighted average inter-
est rates. Variable interest rates are determined using formulas
such as LIBOR+
α
and an index.
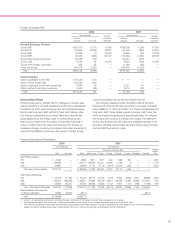
Foreign Exchange Risk
2006 2007
Yen (millions)
Average
Yen (millions)
Average
Contract contractual Contract contractual
amounts Fair value rate (Yen) amounts Fair value rate (Yen)
Forward Exchange Contract
To sell US$ ¥270,070 (1,771) 115.88 ¥336,005 1,299)117.84
To sell EUR 132,694 (3,333) 138.57 60,305 (963) 154.35
To sell CA$ 19,225 (1) 100.59 16,548 (67) 100.88
To sell GBP 82,546 (984) 201.67 173,894 (1,352) 228.48
To sell other foreign currencies 82,985 310)— 36,344 (670) —
To buy US$ 5,535 45)115.78 9,864 (122) 114.93
To buy other foreign currencies 992 22)— 11,358 (85) —
Cross-currencies 304,078 2,228)— 334,676 (1,533) —
Total ¥898,125 (3,484) ¥978,994 (3,493)
Currency Option
Option purchased to sell US$ ¥058,446 520)—¥
,
0,0——)—
Option written to sell US$ 104,576 (323) — — —)—
Option purchased to sell other currencies 4,982 19)— 2,317 24)—
Option written to sell other currencies 8,544 (85) — 3,476 (42) —
Total ¥176,548 131)¥5,793 (18)
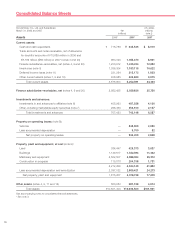
Finance Subsidiaries-Receivables
2006 2007
Yen (millions) Yen (millions)
Average
Expected maturity date
interest
Total Fair value Total Within 1 year 1-2 year 2-3 year 3-4 year 4-5 year Thereafter Fair value rate
Direct Finance Leases*
1
:
JP¥ ¥0,024,450 — ¥0,026,894 15,811 5,571 3,247 1,465 800 — — 4.82%
US$ 1,846,959 — 1,426,173 558,263 531,211 309,651 27,039 9 — — 4.75%
Other 348,691 — 439,499 127,160 97,709 108,119 102,209 4,285 17 — 4.52%
Total—Direct Finance Leases ¥2,220,100 — ¥1,892,566 701,234 634,491 421,017 130,713 5,094 17 —
Other Finance Receivables:
JP¥ ¥0,412,415 377,036 ¥0,402,970 135,176 103,753 75,794 48,250 25,086 14,911 398,869 4.82%
US$ 1,982,413 1,935,956 2,485,210 876,988 525,019 466,471 350,458 210,906 55,368 2,545,210 7.03%
Other 428,934 405,397 487,922 265,085 94,556 67,451 40,621 17,573 2,636 411,955 7.48%
Total—Other Finance Receivables ¥2,823,762 2,718,389 ¥3,376,102 1,277,249 723,328 609,716 439,329 253,565 72,915 3,356,034
Retained interest in the sold pools
of finance receivables*
2
94,634 94,634 88,110 ——————88,110
Total*
3
¥5,138,496 —¥5,356,778 — — — — — — 2,407—
*1: Under U.S. generally accepted accounting principles, disclosure of fair values of direct finance leases is not required.
*2: The retained interest in the sold pools of finance receivables is accounted for as “trading” securities and is reported at fair value.
*3: The finance subsidiaries-receivables include finance subsidiaries-receivables included in trade receivables and other assets in the consolidated balance
sheets. Additional detailed information is described in Note (4) to the accompanying consolidated financial statements.