Honda 2007 Annual Report Download - page 126
Download and view the complete annual report
Please find page 126 of the 2007 Honda annual report below. You can navigate through the pages in the report by either clicking on the pages listed below, or by using the keyword search tool below to find specific information within the annual report.-
 1
1 -
2
-
3
-
4
-
5
-
6
-
7
-
8
-
9
-
10
-
11
-
12
-
13
-
14
-
15
-
16
-
17
-
18
-
19
-
20
-
21
-
22
-
23
-
24
-
25
-
26
-
27
-
28
-
29
-
30
-
31
-
32
-
33
-
34
-
35
-
36
-
37
-
38
-
39
-
40
-
41
-
42
-
43
-
44
-
45
-
46
-
47
-
48
-
49
-
50
-
51
-
52
-
53
-
54
-
55
-
56
-
57
-
58
-
59
-
60
-
61
-
62
-
63
-
64
-
65
-
66
-
67
-
68
-
69
-
70
-
71
-
72
-
73
-
74
-
75
-
76
-
77
-
78
-
79
-
80
-
81
-
82
-
83
-
84
-
85
-
86
-
87
-
88
-
89
-
90
-
91
-
92
-
93
-
94
-
95
-
96
-
97
-
98
-
99
-
100
-
101
-
102
-
103
-
104
-
105
-
106
-
107
-
108
-
109
-
110
-
111
-
112
-
113
-
114
-
115
-
 116
116 -
 117
117 -
 118
118 -
 119
119 -
 120
120 -
 121
121 -
 122
122 -
 123
123 -
 124
124 -
 125
125 -
 126
126 -
 127
127 -
 128
128 -
 129
129 -
 130
130 -
 131
131 -
 132
132 -
 133
133 -
 134
134 -
 135
135 -
 136
136
 |
 |

124
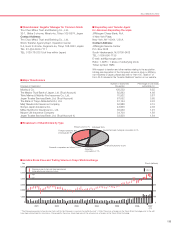
Financial Summary
Honda Motor Co., Ltd. and Subsidiaries
Years ended or at March 31
1997 1998 1999 2000
Sales, income, and dividends
Net sales and other operating revenue ¥5,293,302 ¥5,999,738 ¥6,231,041 ¥6,098,840
Operating income 397,328 456,852 540,978 418,639
Income before income taxes, minority interest and
equity in income of affiliates
395,333 445,583 523,168 419,658
Income taxes 189,044 201,278 229,624 170,434
Minority interest in income (4,611) (2,232) (2,657) (3,595)
Equity in income of affiliates 19,490 18,552 14,158 16,786
Net income 221,168 260,625 305,045 262,415
As percentage of sales 4.2% 4.3% 4.9% 4.3%
Cash dividends paid during the period 13,640 16,563 20,463 20,463
Research and development 251,128 285,863 311,632 334,036
Interest expense 27,514 27,655 27,890 18,920
Assets, long-term debt, and stockholders’ equity
Total assets ¥4,239,794 ¥4,870,128 ¥5,073,660 ¥4,935,976
Long-term debt 734,255 677,750 673,084 574,566
Total stockholders’ equity 1,388,430 1,607,914 1,763,855 1,930,373
Capital expenditures
(excluding purchase of operating lease assets)
217,782 309,517 237,080 222,891
Purchase of operating lease assets
Depreciation
(excluding property on operating leases)
141,351 153,337 177,666 172,139
Depreciation of property on operating leases
Per common share
Net income:
Basic ¥0,0113.50.¥0,0133.74.¥0,0156.52.¥0,0134.65.
Diluted 113.48.133.72.156.52.134.65.
Cash dividends paid during the period 7.0.8.5.10.5.10.5.
Stockholders’ equity 712.52.825.07.905.10.990.53.
Sales progress
Sales amounts:*
Japan ¥1,826,284 ¥1,710,813 ¥1,556,333 ¥1,612,191
35% 29% 25% 26%
Overseas 3,467,018 4,288,925 4,674,708 4,486,649
65% 71% 75% 74%
Total ¥5,293,302 ¥5,999,738 ¥6,231,041 ¥6,098,840
100% 100% 100% 100%
Unit sales:
Motorcycles 5,325 5,257 4,295 4,436
Automobiles 2,184 2,343 2,333 2,473
Power Products 2,521 2,857 3,412 4,057
Number of employees 101,100 109,400 112,200 112,400
Exchange rate (yen amounts per U.S. dollar)
Rates for the period-end ¥0,000,124 ¥0,000,132 ¥0,000,121 ¥0,000,106
Average rates for the period 113 123 128 112
* The geographic breakdown of sales amounts is based on the location of customers.