Honda 2007 Annual Report Download - page 115
Download and view the complete annual report
Please find page 115 of the 2007 Honda annual report below. You can navigate through the pages in the report by either clicking on the pages listed below, or by using the keyword search tool below to find specific information within the annual report.
113
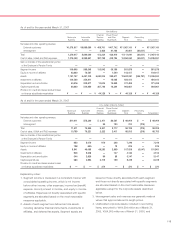
As of and for the year ended March 31, 2007
Yen (millions)
Financial Power Product
Motorcycle Automobile Services and Other Segment Reconciling
Business Business Business Businesses Total Items Consolidated
Net sales and other operating revenue:
External customers ¥1,370,617 ¥8,889,080 ¥0,409,701 ¥417,742 ¥11,087,140 ¥000,0(—.¥11,087,140
Intersegment ——3,633 21,168 24,801 (24,801) —
To t a l 1,370,617 8,889,080 413,334 438,910 11,111,941 (24,801) 11,087,140
Cost of sales, SG&A and R&D expenses 1,270,009 8,289,537 297,792 402,724 10,260,062 (24,801) 10,235,261
Gain on transfer of the substitutional portion
of the Employee’s Pension Funds — — —— —— —
Segment income 100,608 599,543 115,542 36,186 851,879 —851,879
Equity in income of affiliates 23,380 78,537 —1,500 103,417 —103,417
Assets 1,161,707 5,437,709 5,694,204 338,671 12,632,291 (595,791) 12,036,500
Investments in affiliates 109,538 359,811 —15,065 484,414 —484,414
Depreciation and amortization 40,576 309,877 10,676 10,359 371,488 —371,488
Capital expenditures 68,880 540,859 367,728 16,394 993,861 —993,861
Provision for credit and lease residual losses
on finance subsidiaries-receivables ¥0,000,0—.¥0,000,0—.¥0,044,128 ¥000,0—.¥00,044,128 ¥000,0(—.¥00,044,128
As of and for the year ended March 31, 2007
U.S. dollars (millions) (note2)
Financial Power Product
Motorcycle Automobile Services and Other Segment Reconciling
Business Business Business Businesses Total Items Consolidated
Net sales and other operating revenue:
External customers $11,611 $75,300 $03,471 $3,537 $093,919 $000—.$093,919
Intersegment ——30 180 210 (210) —
To t a l 11,611 75,300 3,501 3,717 94,129 (210) 93,919
Cost of sales, SG&A and R&D expenses 10,759 70,221 2,522 3,411 86,913 (210) 86,703
Gain on transfer of the substitutional portion
of the Employee’s Pension Funds — — —— —— —
Segment income 852 5,079 979 306 7,216 —7,216
Equity in income of affiliates 198 665 —13 876 —876
Assets 9,841 46,063 48,235 2,869 107,008 (5,047) 101,961
Investments in affiliates 928 3,048 —127 4,103 —4,103
Depreciation and amortization 344 2,625 90 88 3,147 —3,147
Capital expenditures 583 4,582 3,115 139 8,419 —8,419
Provision for credit and lease residual losses
on finance subsidiaries-receivables $0
0,
0—.$0
0,
0—.$00,374 — $000,374 $000—.$000,374
Explanatory notes:
1. Segment income is measured in a consistent manner with
consolidated operating income, which is net income
before other income, other expenses, income tax (benefit)
expense, minority interest in income, and equity in income
of affiliates. Expenses not directly associated with specific
segments are allocated based on the most reasonable
measures applicable.
2. Assets of each segment are defined as total assets,
including derivative financial instruments, investments in
affiliates, and deferred tax assets. Segment assets are
based on those directly associated with each segment
and those not directly associated with specific segments
are allocated based on the most reasonable measures
applicable except for the corporate assets described
below.
3. Intersegment sales and revenues are generally made at
values that approximate arm’s-length prices.
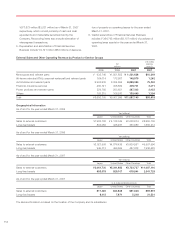
4. Unallocated corporate assets, included in reconciling
items, amounted to ¥464,504 million as of March 31,
2005, ¥354,903 million as of March 31, 2006, and


