Honda 2007 Annual Report Download - page 62
Download and view the complete annual report
Please find page 62 of the 2007 Honda annual report below. You can navigate through the pages in the report by either clicking on the pages listed below, or by using the keyword search tool below to find specific information within the annual report.-
 1
1 -
2
-
3
-
4
-
5
-
6
-
7
-
8
-
9
-
10
-
11
-
12
-
13
-
14
-
15
-
16
-
17
-
18
-
19
-
20
-
21
-
22
-
23
-
24
-
25
-
26
-
27
-
28
-
29
-
30
-
31
-
32
-
33
-
34
-
35
-
36
-
37
-
38
-
39
-
40
-
41
-
42
-
43
-
44
-
45
-
46
-
47
-
48
-
49
-
50
-
51
-
 52
52 -
 53
53 -
 54
54 -
 55
55 -
 56
56 -
 57
57 -
 58
58 -
 59
59 -
 60
60 -
 61
61 -
 62
62 -
 63
63 -
 64
64 -
 65
65 -
 66
66 -
 67
67 -
 68
68 -
 69
69 -
 70
70 -
 71
71 -
 72
72 -
73
-
74
-
75
-
76
-
77
-
78
-
79
-
80
-
81
-
82
-
83
-
84
-
85
-
86
-
87
-
88
-
89
-
90
-
91
-
92
-
93
-
94
-
95
-
96
-
97
-
98
-
99
-
100
-
101
-
102
-
103
-
104
-
105
-
106
-
107
-
108
-
109
-
110
-
111
-
112
-
113
-
114
-
115
-
116
-
117
-
118
-
119
-
120
-
121
-
122
-
123
-
124
-
125
-
126
-
127
-
128
-
129
-
130
-
131
-
132
-
133
-
134
-
135
-
136
 |
 |

60
Geographical Information
Japan
In Japan, revenue from domestic and export sales was
¥4,774.1 billion, up 7.6% compared to the previous fiscal year,
due primarily to the increased revenue from exports in auto-
mobile business which offset the negative impact of the
decreased unit sales in domestic automobile business. Operat-
ing income was ¥228.1 billion, down 38.5%, compared to the
previous fiscal year, due primarily to the negative impact of the
changes in the model mix, substantially increased raw material
costs, increased SG&A expenses, increased R&D expenses
and the absence of a gain on the return of the substitutional
portion of the Employee Pension Funds of the Japanese gov-
ernment which was present in fiscal year 2006, which offset
the positive impact of the increased profit attributable to higher
revenue, continuing cost reduction effects and the currency
effects caused by the depreciation of the Japanese yen. The
operating margin was 4.8%.
North America
In North America, which mainly consists of the United States,
revenue increased 9.9%, to ¥6,172.6 billion, due mainly to
increased unit sales in the automobile business and the posi-
tive impact of currency translation effects. Operating income
increased 29.1%, to ¥456.8 billion, from the previous fiscal
year, due primarily to the positive impacts of increased profit
attributable to higher revenue, continuing cost reduction
effects, decreased SG&A expenses and the currency effects
caused by the depreciation of the Japanese yen, which offset
the negative impacts of the change in model mix and sub-
stantially increased raw material costs. The operating margin
was 7.4%.
Europe
In Europe, revenue increased 13.3%, to ¥1,347.7 billion, com-
pared to the previous fiscal year, due primarily to increased unit
sales in the automobile and power product businesses and the
positive impact of currency translation effects. Operating
income increased 21.6%, to ¥31.9 billion, from the previous
fiscal year, due mainly to the positive impacts of increased
profit attributable to higher revenue, continuing cost reduction
and the currency effects caused by the depreciation of the
Japanese yen, which offset the negative impacts of the change
in model mix and increased SG&A expenses. The operating
margin was 2.4%.
Asia
In Asia, revenue increased 27.5%, to ¥1,271.4 billion from the
previous fiscal year, due primarily to increased unit sales in the
automobile business and the positive impact of currency trans-
lation effects. Operating income increased 18.7%, to ¥77.1 bil-
lion, from the previous fiscal year, due mainly to the positive
impacts of increased profit attributable to higher revenue,
which offset the negative impact of increased SG&A expenses.
The operating margin was 6.1%.
Other Regions
In other regions, revenue increased 39.5%, to ¥797.6 billion,
compared to the previous fiscal year, due mainly to increased
unit sales in all of the business segments and the positive
impact of currency translation effects. Operating income rose
26.4%, to ¥72.2 billion, from the previous fiscal year, due
mainly to the positive impact of the increased profit attributable
to higher revenue, and the currency effects caused by the
depreciation of the Japanese yen, offsetting the negative
impact of increased SG&A expenses. The operating margin
was 9.1%.
As described in Note (1) (v) and Note (3) to our consolidated
financial statements, certain revisions for misclassifications and
reclassifications have been made to the prior years’ consoli-
dated financial statements to conform to the presentation used
for the fiscal year ended March 31, 2007.
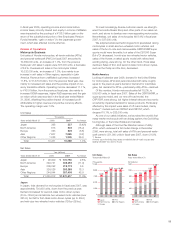
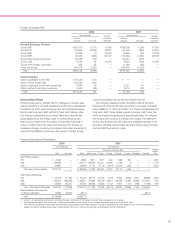
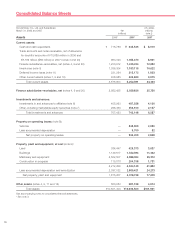
The finance subsidiaries-receivables category above includes items that have
been reclassified as trade receivables and other assets. For more detailed
information, refer to Note (4) to the consolidated financial statements,
Finance Subsidiaries-Receivables and Securitizations.
480
360
240
120
0
6,000
4,500
3,000
1,500
0
03 04 05 06 07 03 04 05 06 07
240
413
245 259
310
3,327
5,144
3,641
4,149
4,840
Finance Subsidiaries-Receivables,
Net
Years ended March 31
Yen (billions)
Net Sales
Y
ears ended March 31
Y
en (billions)
Non-current Current
Research and Development
Using the most advanced technologies, Honda Motor Com-
pany and its consolidated subsidiaries conduct R&D activities
aimed at creating distinctive products that are internationally
competitive. The Group’s main R&D divisions operate indepen-
dently as subsidiaries, allowing technicians to pursue their
tasks with significant freedom.
Product-related research and development is spearheaded
by the Honda R&D Co., Ltd., Honda R&D Americas, Inc., in the
United States and Honda R&D Europe (Deutschland) GmbH in
Germany. Research and development on production technolo-
gies centers on Honda Engineering Co., Ltd., in Japan and
Honda Engineering North America, Inc. All of these entities
work in close association with our other entities and business
in their respective regions. Total consolidated R&D expendi-
tures for the year ended March 31, 2007 amounted to ¥551.8
billion. Main R&D activities conducted by each business
segment are outlined below.
Motorcycle Business
Honda is committed to developing motorcycles with new
value-added features that meet the individual needs of
customers around the world, and to implementing timely local