Honda 2007 Annual Report Download - page 118
Download and view the complete annual report
Please find page 118 of the 2007 Honda annual report below. You can navigate through the pages in the report by either clicking on the pages listed below, or by using the keyword search tool below to find specific information within the annual report.-
 1
1 -
2
-
3
-
4
-
5
-
6
-
7
-
8
-
9
-
10
-
11
-
12
-
13
-
14
-
15
-
16
-
17
-
18
-
19
-
20
-
21
-
22
-
23
-
24
-
25
-
26
-
27
-
28
-
29
-
30
-
31
-
32
-
33
-
34
-
35
-
36
-
37
-
38
-
39
-
40
-
41
-
42
-
43
-
44
-
45
-
46
-
47
-
48
-
49
-
50
-
51
-
52
-
53
-
54
-
55
-
56
-
57
-
58
-
59
-
60
-
61
-
62
-
63
-
64
-
65
-
66
-
67
-
68
-
69
-
70
-
71
-
72
-
73
-
74
-
75
-
76
-
77
-
78
-
79
-
80
-
81
-
82
-
83
-
84
-
85
-
86
-
87
-
88
-
89
-
90
-
91
-
92
-
93
-
94
-
95
-
96
-
97
-
98
-
99
-
100
-
101
-
102
-
103
-
104
-
105
-
106
-
107
-
 108
108 -
 109
109 -
 110
110 -
 111
111 -
 112
112 -
 113
113 -
 114
114 -
 115
115 -
 116
116 -
 117
117 -
 118
118 -
 119
119 -
 120
120 -
 121
121 -
 122
122 -
 123
123 -
 124
124 -
 125
125 -
 126
126 -
 127
127 -
 128
128 -
129
-
130
-
131
-
132
-
133
-
134
-
135
-
136
 |
 |

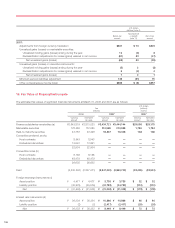
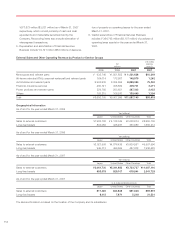
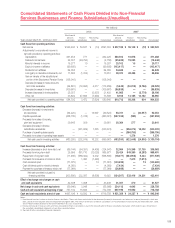
116
As of and for the year ended March 31, 2006
Yen (millions)
North Other Reconciling
Japan America Europe Asia Regions Total Items Consolidated
Net sales and other
operating revenue:
External customers ¥2,021,999 ¥5,475,261 ¥1,001,177 ¥856,892 ¥552,667 ¥09,907,996 ¥0,(000,0—.¥09,907,996
Transfers between
geographic areas 2,415,874 141,064 188,341 140,501 19,023 2,904,803 (2,904,803) —
Total 4,437,873 5,616,325 1,189,518 997,393 571,690 12,812,799 (2,904,803) 9,907,996
Cost of sales, SG&A and
R&D expenses 4,204,939 5,262,382 1,163,213 932,394 514,527 12,077,455 (2,900,348) 9,177,107
Gain on transfer of the substitutional
portion of the Employees’ Pension
Funds 138,016 — — — — 138,016 — 138,016
Operating income 370,950 353,943 26,305 64,999 57,163 873,360 (4,455) 868,905
Assets 2,695,212 6,128,303 800,786 717,933 309,209 10,651,443 (20,043) 10,631,400
Long-lived assets ¥0,949,713 ¥0,589,596 ¥0,157,819 ¥167,148 ¥072,244 ¥01,936,520 ¥0,(000,0—.¥01,936,520
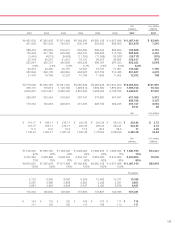
As of and for the year ended March 31, 2007
Yen (millions)
North Other Reconciling
Japan America Europe Asia Regions Total Items Consolidated
Net sales and other
operating revenue:
External customers ¥2,061,720 ¥6,002,797 ¥1,228,564 ¥1,024,680 ¥769,379 ¥11,087,140 ¥0,(000,0—.¥11,087,140
Transfers between
geographic areas 2,712,403 169,847 119,161 246,723 28,259 3,276,393 (3,276,393) —
Total 4,774,123 6,172,644 1,347,725 1,271,403 797,638 14,363,533 (3,276,393) 11,087,140
Cost of sales, SG&A and
R&D expenses 4,545,988 5,715,817 1,315,736 1,194,250 725,377 13,497,168 (3,261,907) 10,235,261
Gain on transfer of the substitutional
portion of the Employees’ Pension
Funds ————— —— —
Operating income 228,135 456,827 31,989 77,153 72,261 866,365 (14,486) 851,879
Assets 2,985,123 6,834,409 948,922 935,963 414,147 12,118,564 (82,064) 12,036,500
Long-lived assets ¥0,993,078 ¥1,028,132 ¥0,198,232 ¥0,228,802 ¥093,485 ¥02,541,729 ¥0,(000,0—.¥02,541,729