Honda 2007 Annual Report Download - page 22
Download and view the complete annual report
Please find page 22 of the 2007 Honda annual report below. You can navigate through the pages in the report by either clicking on the pages listed below, or by using the keyword search tool below to find specific information within the annual report.-
 1
1 -
2
-
3
-
4
-
5
-
6
-
7
-
8
-
9
-
10
-
11
-
 12
12 -
 13
13 -
 14
14 -
 15
15 -
 16
16 -
 17
17 -
 18
18 -
 19
19 -
 20
20 -
 21
21 -
 22
22 -
 23
23 -
 24
24 -
 25
25 -
 26
26 -
 27
27 -
 28
28 -
 29
29 -
 30
30 -
 31
31 -
 32
32 -
33
-
34
-
35
-
36
-
37
-
38
-
39
-
40
-
41
-
42
-
43
-
44
-
45
-
46
-
47
-
48
-
49
-
50
-
51
-
52
-
53
-
54
-
55
-
56
-
57
-
58
-
59
-
60
-
61
-
62
-
63
-
64
-
65
-
66
-
67
-
68
-
69
-
70
-
71
-
72
-
73
-
74
-
75
-
76
-
77
-
78
-
79
-
80
-
81
-
82
-
83
-
84
-
85
-
86
-
87
-
88
-
89
-
90
-
91
-
92
-
93
-
94
-
95
-
96
-
97
-
98
-
99
-
100
-
101
-
102
-
103
-
104
-
105
-
106
-
107
-
108
-
109
-
110
-
111
-
112
-
113
-
114
-
115
-
116
-
117
-
118
-
119
-
120
-
121
-
122
-
123
-
124
-
125
-
126
-
127
-
128
-
129
-
130
-
131
-
132
-
133
-
134
-
135
-
136
 |
 |

CR-V
20
70.0
60.0
50.0
40.0
3.50
3.00
2.50
2.00
1.50
(US$/barrel)
Jan.
05
Mar. May Jul. Sep. Nov. Jan.
06
Mar. May Jul. Sep. Nov. Jan.
07
Mar. May
Crude oil (WTI) (left scale)
Regular gasoline (right scale)
(US$/gallon)
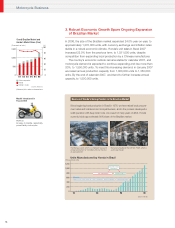
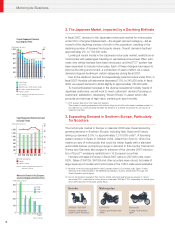
Crude Oil Prices and Prices of Regular Gasoline in the United States
Source: EIA (Energy Information Administration)
1,500
1,000
500
0
02 03 04 05 06 07
Years ended March 31
Passenger cars
Light trucks
Honda’s Unit Sales in
the United States
(Thousands
of units)
200
180
160
140
120
100
80
02 03 04 05 06
Demand for Light Trucks Overall
and by Segment
Entry-level CUVs (crossovers)
Light truck total
Full-size SUVs and pickups
Source: Global Insight
2002 = 100
200
180
160
140
120
100
80 02 03 04 05 06
Demand for Passenger Cars Overall
and by Segment
Subcompacts
Passenger car total
Source: Global Insight
2002 = 100
Models Introduced in Fiscal
2007 (United States)
Fit
15,000
10,000
5,000
001 02 03 04 05 06
10
8
6
4
2
0
Source: Global Insight
Passenger cars
Light trucks
Honda’s share
(%)
Total U.S. Market Demand
by Category (Year)
(Thousands
of units)
Acura MDX
Acura RDX
Automobile Business
2. Growing North American Demand for Fuel-Efficient
Vehicles
Total demand in the United States in calendar 2006 fell 2.6% from the pre-
ceding year, to approximately 16,550,000 units. Soaring gasoline prices in
the summer buying season pushed up demand for fuel-efficient cars. This
trend enhanced demand for subcompact cars and crossover-utility vehicles
(CUVs), which aim for SUV* utility and are based on passenger car platforms.
* Sport-utility vehicle (SUV): A vehicle designed and developed for recreational purposes
Honda enjoyed a 2.8% increase in sales in the United States during fiscal
2007, to 1,529,000 units. We benefited from the launch of the Fit, which first
went on sale in April, and the introduction of the CR-V, an entry-level CUV,
in September following a full model change. In the area of manufacturing,
we responded to rising demand for the fuel-efficient Civic by starting pro-
duction in April 2007 on the second line in Canada. As part of this process,
we shifted production of the Pilot from this line to our plant in Alabama.
In calendar 2007, we expect overall U.S. automobile demand to fall
slightly below the level of calendar 2006, coming to slightly less than
16,400,000 units. Affecting this demand, the U.S. economic environment