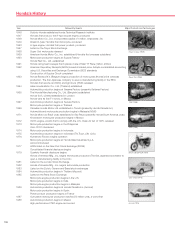
Honda 2007 Annual Report Download - page 125
Download and view the complete annual report
Please find page 125 of the 2007 Honda annual report below. You can navigate through the pages in the report by either clicking on the pages listed below, or by using the keyword search tool below to find specific information within the annual report.-
 1
1 -
2
-
3
-
4
-
5
-
6
-
7
-
8
-
9
-
10
-
11
-
12
-
13
-
14
-
15
-
16
-
17
-
18
-
19
-
20
-
21
-
22
-
23
-
24
-
25
-
26
-
27
-
28
-
29
-
30
-
31
-
32
-
33
-
34
-
35
-
36
-
37
-
38
-
39
-
40
-
41
-
42
-
43
-
44
-
45
-
46
-
47
-
48
-
49
-
50
-
51
-
52
-
53
-
54
-
55
-
56
-
57
-
58
-
59
-
60
-
61
-
62
-
63
-
64
-
65
-
66
-
67
-
68
-
69
-
70
-
71
-
72
-
73
-
74
-
75
-
76
-
77
-
78
-
79
-
80
-
81
-
82
-
83
-
84
-
85
-
86
-
87
-
88
-
89
-
90
-
91
-
92
-
93
-
94
-
95
-
96
-
97
-
98
-
99
-
100
-
101
-
102
-
103
-
104
-
105
-
106
-
107
-
108
-
109
-
110
-
111
-
112
-
113
-
114
-
 115
115 -
 116
116 -
 117
117 -
 118
118 -
 119
119 -
 120
120 -
 121
121 -
 122
122 -
 123
123 -
 124
124 -
 125
125 -
 126
126 -
 127
127 -
 128
128 -
 129
129 -
 130
130 -
 131
131 -
 132
132 -
 133
133 -
 134
134 -
 135
135 -
136
 |
 |

123
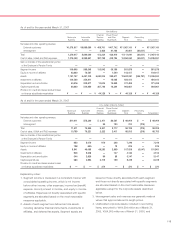
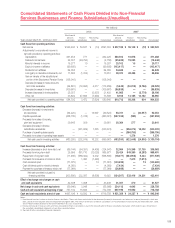
Yen (millions)
2006 2007
Non-financial Non-financial
services Finance Reconciling services Finance Reconciling
Years ended March 31, 2006 and 2007
businesses subsidiaries items Consolidated businesses subsidiaries items Consolidated
Cash flows from operating activities:
Net income
¥(543,200 ¥(053,847 ¥00,0(14) ¥597,033 ¥(537,186 ¥(055,149 ¥00,0(13) ¥0592,322
Adjustments to reconcile net income to
net cash provided by operating activities:
Depreciation
261,454 771 — 262,225 360,812 10,676 —371,488
Deferred income taxes
22,037 (24,793) — (2,756) (35,483) 19,035 —(16,448)
Minority interests in income
15,277 10 — 15,287 20,102 15 —20,117
Equity in income of affiliates
(99,605) — — (99,605) (103,417) ——(103,417)
Dividends from affiliates
64,055 — — 64,055 54,849 ——54,849
Loss (gain) on derivative instruments, net
11,683 (1,332) — 10,351 28,370 28,466 —56,836
Gain on transfer of the substitutional
portion of the Employees’ Pension Funds
(138,016) — — (138,016) ——— —
Decrease (increase) in trade accounts
and notes receivable
(44,881) (72,695) 4,317 (113,259) (5,445) (34,318) (9,766) (49,529)
Decrease (increase) in inventories
(109,661) — — (109,661) (96,839) ——(96,839)
Increase (decrease) in trade payables
25,357 — (3,937) 21,420 41,965 —(3,779) 38,186
Other, net
33,892 47,664 (7,990) 73,566 8,613 14,185 14,162 36,960
Net cash provided by operating activities
584,792 3,472 (7,624) 580,640 810,713 93,208 604 904,525
Cash flows from investing activities:
Decrease (increase) in investments
and advances
(64,220) — 14,697 (49,523) 93,311 —(40,957) 52,354
Capital expenditures
(458,705) (1,316) — (460,021) (597,025) (933) —(597,958)
Proceeds from sales of property,
plant and equipment
39,645 306 — 39,951 20,364 277 —20,641
Decrease (increase) in finance
subsidiaries–receivables
— (231,909) 1,535 (230,374) —(256,274) 16,052 (240,222)
Purchase of operating lease assets
—————(366,795) —(366,795)
Proceeds from sales of operating lease assets
—————1,276 —1,276
Net cash used in investing activities
(483,280) (232,919) 16,232 (699,967) (483,350) (622,449) (24,905) (1,130,704)
Cash flows from financing activities:
Increase (decrease) in short-term debt, net
(66,144) (54,391) (4,406) (124,941) 32,964 241,349 31,750 306,063
Proceeds from long-term debt
25,995 851,710 (12,028) 865,677 25,424 949,360 (5,293) 969,491
Repayment of long-term debt
(11,485) (566,422) 9,302 (568,605) (18,077) (664,906) 5,444 (677,539)
Proceeds from issuance of common stock
— 1,490 (1,490) — —7,613 (7,613) —
Cash dividends paid
(71,075) — 14 (71,061) (140,495) —13 (140,482)
Cash dividends paid to minority interests
(4,083) — — (4,083) (7,434) ——(7,434)
Payment for purchase of treasury stock, net
(77,064) — — (77,064) (26,689) ——(26,689)
Net cash provided by (used in)
financing activities
(203,856) 232,387 (8,608) 19,923 (134,307) 533,416 24,301 423,410
Effect of exchange rate changes on cash
and cash equivalents
42,398 1,008 — 43,406 31,057 470 —31,527
Net change in cash and cash equivalents
(59,946) 3,948 — (55,998) 224,113 4,645 —228,758
Cash and cash equivalents at beginning of year
757,142 15,644 — 772,786 697,196 19,592 —716,788
Cash and cash equivalents at end of year
¥(697,196 ¥(019,592 ¥00(0,—.¥716,788 ¥(921,309 ¥(024,237 ¥00,(0—.¥0945,546
Notes:
1. Non-financial services businesses lend to finance subsidiaries. These cash flows are included in the decrease (increase) in investments and advances, increase (decrease) in short-term
debt, proceeds from long-term debt, and repayment of longterm debt. The amount of the loans to finance subsidiaries is a ¥13,242 million increase for the year ended March 31, 2006,
and a ¥48,570 million decrease for the year ended March 31, 2007, respectively.
2. Decrease (increase) in trade accounts and notes receivable for finance subsidiaries is due to the reclassification of finance subsidiaries-receivables which relate to sales of inventory in
the unaudited consolidated statements of cash flows presented above.
3. See note 3 to the consolidated financial statements.
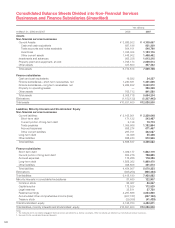
Consolidated Statements of Cash Flows Divided into Non-Financial
Services Businesses and Finance Subsidiaries (Unaudited)