Honda 2007 Annual Report Download - page 116
Download and view the complete annual report
Please find page 116 of the 2007 Honda annual report below. You can navigate through the pages in the report by either clicking on the pages listed below, or by using the keyword search tool below to find specific information within the annual report.-
 1
1 -
2
-
3
-
4
-
5
-
6
-
7
-
8
-
9
-
10
-
11
-
12
-
13
-
14
-
15
-
16
-
17
-
18
-
19
-
20
-
21
-
22
-
23
-
24
-
25
-
26
-
27
-
28
-
29
-
30
-
31
-
32
-
33
-
34
-
35
-
36
-
37
-
38
-
39
-
40
-
41
-
42
-
43
-
44
-
45
-
46
-
47
-
48
-
49
-
50
-
51
-
52
-
53
-
54
-
55
-
56
-
57
-
58
-
59
-
60
-
61
-
62
-
63
-
64
-
65
-
66
-
67
-
68
-
69
-
70
-
71
-
72
-
73
-
74
-
75
-
76
-
77
-
78
-
79
-
80
-
81
-
82
-
83
-
84
-
85
-
86
-
87
-
88
-
89
-
90
-
91
-
92
-
93
-
94
-
95
-
96
-
97
-
98
-
99
-
100
-
101
-
102
-
103
-
104
-
105
-
 106
106 -
 107
107 -
 108
108 -
 109
109 -
 110
110 -
 111
111 -
 112
112 -
 113
113 -
 114
114 -
 115
115 -
 116
116 -
 117
117 -
 118
118 -
 119
119 -
 120
120 -
 121
121 -
 122
122 -
 123
123 -
 124
124 -
 125
125 -
 126
126 -
127
-
128
-
129
-
130
-
131
-
132
-
133
-
134
-
135
-
136
 |
 |

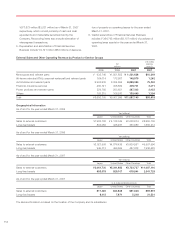
114
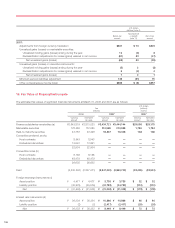
¥377,873 million ($3,201 million) as of March 31, 2007
respectively, which consist primarily of cash and cash
equivalents and marketable securities held by the
Company. Reconciling items also include elimination of
intersegment transactions.
5. Depreciation and amortization of Financial Services
Business include ¥ 9,741 million ($83 million) of deprecia-
tion of property on operating leases for the year ended
March 31, 2007.
6. Capital expenditure of Financial Services Business
includes ¥ 366,795 million ($3,107 million) of purchase of
operating lease assets for the year ended March 31,
2007.
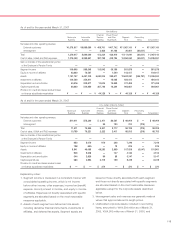
External Sales and Other Operating Revenue by Product or Service Groups
U.S. dollars
Yen (millions)
(millions) (note 2)
2005 2006 2007 2007
Motorcycles and relevant parts ¥0,933,740 ¥1,051,855 ¥01,221,638 $10,349
All-terrain vehicles (ATVs), personal watercraft and relevant parts 164,014 173,957 148,979 1,262
Automobiles and relevant parts 6,963,635 8,004,694 8,889,080 75,300
Financial, insurance services 255,741 306,869 409,701 3,471
Power products and relevant parts 229,760 263,651 287,302 2,433
Others 103,215 106,970 130,440 1,104
Total ¥8,650,105 ¥9,907,996 ¥11,087,140 $93,919
Geographical Information
As of and for the year ended March 31, 2005
Yen (millions)
Japan United States Other Countries Total
Sales to external customers ¥1,983,182 ¥ 4,138,049 ¥2,528,874 ¥8,650,105
Long-lived assets 894,065 428,467 360,680 1,683,212
As of and for the year ended March 31, 2006
Yen (millions)
Japan United States Other Countries Total
Sales to external customers ¥2,021,999 ¥4,876,436 ¥3,009,561 ¥9,907,996
Long-lived assets 949,713 499,599 487,208 1,936,520
As of and for the year ended March 31, 2007
Yen (millions)
Japan United States Other Countries Total
Sales to external customers ¥2,061,720 ¥5,291,683 ¥3,733,737 ¥11,087,140
Long-lived assets 993,078 929,107 619,544 2,541,729
As of and for the year ended March 31, 2007
U.S. dollars (millions) (note 2)
Japan United States Other Countries Total
Sales to external customers $17,465 $44,826 $31,628 $93,919
Long-lived assets 8,412 7,871 5,248 21,531
The above information is based on the location of the Company and its subsidiaries.