Honda 2007 Annual Report Download - page 108
Download and view the complete annual report
Please find page 108 of the 2007 Honda annual report below. You can navigate through the pages in the report by either clicking on the pages listed below, or by using the keyword search tool below to find specific information within the annual report.-
 1
1 -
2
-
3
-
4
-
5
-
6
-
7
-
8
-
9
-
10
-
11
-
12
-
13
-
14
-
15
-
16
-
17
-
18
-
19
-
20
-
21
-
22
-
23
-
24
-
25
-
26
-
27
-
28
-
29
-
30
-
31
-
32
-
33
-
34
-
35
-
36
-
37
-
38
-
39
-
40
-
41
-
42
-
43
-
44
-
45
-
46
-
47
-
48
-
49
-
50
-
51
-
52
-
53
-
54
-
55
-
56
-
57
-
58
-
59
-
60
-
61
-
62
-
63
-
64
-
65
-
66
-
67
-
68
-
69
-
70
-
71
-
72
-
73
-
74
-
75
-
76
-
77
-
78
-
79
-
80
-
81
-
82
-
83
-
84
-
85
-
86
-
87
-
88
-
89
-
90
-
91
-
92
-
93
-
94
-
95
-
96
-
97
-
 98
98 -
 99
99 -
 100
100 -
 101
101 -
 102
102 -
 103
103 -
 104
104 -
 105
105 -
 106
106 -
 107
107 -
 108
108 -
 109
109 -
 110
110 -
 111
111 -
 112
112 -
 113
113 -
 114
114 -
 115
115 -
 116
116 -
 117
117 -
 118
118 -
119
-
120
-
121
-
122
-
123
-
124
-
125
-
126
-
127
-
128
-
129
-
130
-
131
-
132
-
133
-
134
-
135
-
136
 |
 |

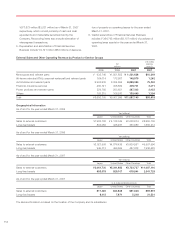
106
U.S. dollars
(millions) (note 2)
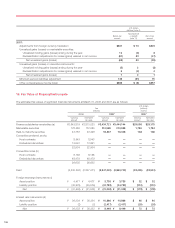
Tax (expense)
Before-tax or benefit Net-of-tax
amount (note 11) amount
2007:
Adjustments from foreign currency translation $807 $(13 $820
Unrealized gains (losses) on marketable securities:
Unrealized holding gains (losses) arising during the year 12 (3) 8
Reclassification adjustments for losses (gains) realized in net income (81) 33 (47)
Net unrealized gains (losses) (69) 30 (39)
Unrealized gains (losses) on derivative instruments:
Unrealized holding gains (losses) arising during the year (5) 2 (3)
Reclassification adjustments for losses (gains) realized in net income 6 (2) 4
Net unrealized gains (losses) 101
Minimum pension liabilities adjustment 126 (51) 75
Other comprehensive income (loss) $865 $0(8) $857
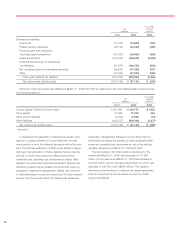
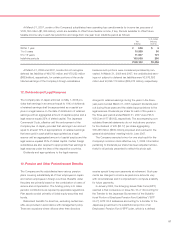
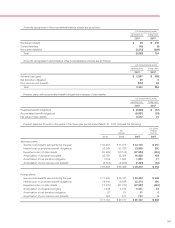
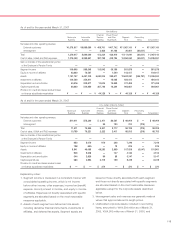
16. Fair Value of Financial Instruments
The estimated fair values of significant financial instruments at March 31, 2006 and 2007 are as follows:
U.S. dollars
Yen (millions)
(millions) (note 2)
2006 2007 2007
Carrying Estimated Carrying Estimated Carrying Estimated
amount fair value amount fair value amount fair value
Finance subsidiaries–receivables (a) ¥2,843,819 ¥2,813,023 ¥3,434,721 ¥3,444,144 $29,095 $29,175
Marketable securities 172,385 172,385 210,598 210,598 1,784 1,784
Held-to-maturity securities 43,767 43,428 16,337 16,348 138 138
Convertible preferred stocks
Host contracts 8,943 8,943 —— ——
Embedded derivatives 13,991 13,991 —— ——
22,934 22,934 —— ——
Convertible notes (b)
Host contracts 8,156 8,156 —— ——
Embedded derivatives 48,479 48,479 —— ——
56,635 56,635 —— ——
Debt (3,230,202) (3,237,471) (3,947,020) (3,960,743) (33,435) (33,551)
Foreign exchange instruments (c)
Asset position ¥0,004,477 ¥0,004,477 ¥0,003,735 ¥0,003,735 $00,032 $00,032
Liability position (35,979) (35,979) (24,783) (24,783) (210) (210)
Net ¥00(31,502) ¥00(31,502) ¥00(21,048) ¥00(21,048) $00(178) $00(178)
Interest rate instruments (d)
Asset position ¥0,036,334 ¥0,036,334 ¥0,010,866 ¥0,010,866 $00,092 $00,092
Liability position (2) (2) (2,417) (2,417) (20) (20)
Net ¥0,036,332 ¥0,036,332 ¥0,008,449 ¥0,008,449 $00(072 $00(072