Honda 2007 Annual Report Download - page 92
Download and view the complete annual report
Please find page 92 of the 2007 Honda annual report below. You can navigate through the pages in the report by either clicking on the pages listed below, or by using the keyword search tool below to find specific information within the annual report.-
 1
1 -
2
-
3
-
4
-
5
-
6
-
7
-
8
-
9
-
10
-
11
-
12
-
13
-
14
-
15
-
16
-
17
-
18
-
19
-
20
-
21
-
22
-
23
-
24
-
25
-
26
-
27
-
28
-
29
-
30
-
31
-
32
-
33
-
34
-
35
-
36
-
37
-
38
-
39
-
40
-
41
-
42
-
43
-
44
-
45
-
46
-
47
-
48
-
49
-
50
-
51
-
52
-
53
-
54
-
55
-
56
-
57
-
58
-
59
-
60
-
61
-
62
-
63
-
64
-
65
-
66
-
67
-
68
-
69
-
70
-
71
-
72
-
73
-
74
-
75
-
76
-
77
-
78
-
79
-
80
-
81
-
 82
82 -
 83
83 -
 84
84 -
 85
85 -
 86
86 -
 87
87 -
 88
88 -
 89
89 -
 90
90 -
 91
91 -
 92
92 -
 93
93 -
 94
94 -
 95
95 -
 96
96 -
 97
97 -
 98
98 -
 99
99 -
 100
100 -
 101
101 -
 102
102 -
103
-
104
-
105
-
106
-
107
-
108
-
109
-
110
-
111
-
112
-
113
-
114
-
115
-
116
-
117
-
118
-
119
-
120
-
121
-
122
-
123
-
124
-
125
-
126
-
127
-
128
-
129
-
130
-
131
-
132
-
133
-
134
-
135
-
136
 |
 |

90
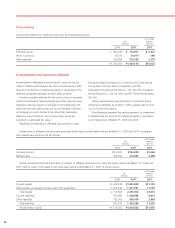
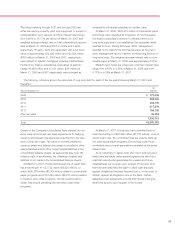
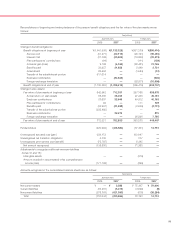
7. Investments and Advances
Investments and advances at March 31, 2006 and 2007 consisted of the following:
U.S. dollars
Yen (millions)
(millions) (note 2)
2006* 2007 2007
Current
Auction rate securities ¥30,539 ¥41,318 $350
Corporate debt securities 13,100 311 3
U.S. government and agency debt securities 18,733 2,993 25
Commercial paper 5,998 ——
Advances 829 581 5
¥69,199 ¥45,203 $383
* See note 3.
Investments and advances due within one year are included in other current assets.
U.S. dollars
Yen (millions)
(millions) (note 2)
2006* 2007 2007
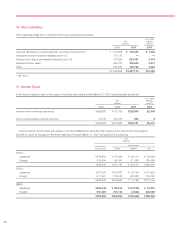
Noncurrent
Marketable equity securities ¥141,846 ¥169,280 $1,434
Convertible preferred stocks 22,934 ——
Convertible notes 56,635 ——
Government bonds 2,999 2,999 25
U.S. government and agency debt securities 2,937 10,034 85
Non-marketable equity securities accounted for under the cost method
Non-marketable preferred stocks 6,000 2,000 17
Other 13,357 11,639 99
Guaranty deposits 30,110 30,847 261
Advances 2,209 2,481 21
Other 19,433 25,330 215
¥298,460 ¥254,610 $2,157
* See note 3.
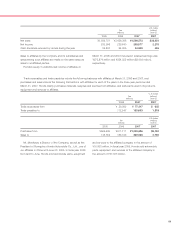
Certain information with respect to marketable securities at March 31, 2006 and 2007, is summarized below:
U.S. dollars
Yen (millions)
(millions) (note 2)
2006 2007 2007
Available-for-sale
Cost ¥060,905 ¥107,573 $0,911
Fair value 172,385 210,598 1,784
Gross unrealized gains 111,540 103,113 874
Gross unrealized losses 60 88 1
Held-to-maturity
Amortized cost ¥043,767 ¥016,337 $138
Fair value 43,428 16,348 138
Gross unrealized gains 126 0
Gross unrealized losses 340 15 0