Honda 2007 Annual Report Download - page 114
Download and view the complete annual report
Please find page 114 of the 2007 Honda annual report below. You can navigate through the pages in the report by either clicking on the pages listed below, or by using the keyword search tool below to find specific information within the annual report.-
 1
1 -
2
-
3
-
4
-
5
-
6
-
7
-
8
-
9
-
10
-
11
-
12
-
13
-
14
-
15
-
16
-
17
-
18
-
19
-
20
-
21
-
22
-
23
-
24
-
25
-
26
-
27
-
28
-
29
-
30
-
31
-
32
-
33
-
34
-
35
-
36
-
37
-
38
-
39
-
40
-
41
-
42
-
43
-
44
-
45
-
46
-
47
-
48
-
49
-
50
-
51
-
52
-
53
-
54
-
55
-
56
-
57
-
58
-
59
-
60
-
61
-
62
-
63
-
64
-
65
-
66
-
67
-
68
-
69
-
70
-
71
-
72
-
73
-
74
-
75
-
76
-
77
-
78
-
79
-
80
-
81
-
82
-
83
-
84
-
85
-
86
-
87
-
88
-
89
-
90
-
91
-
92
-
93
-
94
-
95
-
96
-
97
-
98
-
99
-
100
-
101
-
102
-
103
-
 104
104 -
 105
105 -
 106
106 -
 107
107 -
 108
108 -
 109
109 -
 110
110 -
 111
111 -
 112
112 -
 113
113 -
 114
114 -
 115
115 -
 116
116 -
 117
117 -
 118
118 -
 119
119 -
 120
120 -
 121
121 -
 122
122 -
 123
123 -
 124
124 -
125
-
126
-
127
-
128
-
129
-
130
-
131
-
132
-
133
-
134
-
135
-
136
 |
 |

112
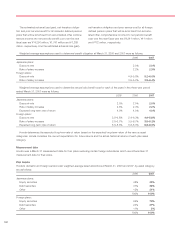
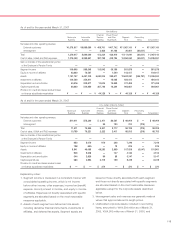
Segment Information
As of and for the year ended March 31, 2005
Yen (millions)
Financial Power Product
Motorcycle Automobile Services and Other Segment Reconciling
Business Business Business Businesses Total Items Consolidated
Net sales and other operating revenue:
External customers ¥1,097,754 ¥6,963,635 ¥0,255,741 ¥332,975 ¥8,650,105 ¥000,0(—.¥8,650,105
Intersegment — — 3,447 9,869 13,316 (13,316) —
Total 1,097,754 6,963,635 259,188 342,844 8,663,421 (13,316) 8,650,105
Cost of sales, SG&A and R&D expenses 1,028,422 6,511,253 169,287 323,539 8,032,501 (13,316) 8,019,185
Gain on transfer of the substitutional portion
of the Employee’s Pension Funds — — — — — — —
Segment income 69,332 452,382 89,901 19,305 630,920 — 630,920
Equity in income of affiliates 29,921 65,183 — 953 96,057 — 96,057
Assets 848,671 4,265,636 4,333,605 261,843 9,709,755 (341,519) 9,368,236
Investments in affiliates 79,143 249,876 — 17,279 346,298 — 346,298
Depreciation and amortization 28,606 189,150 419 7,577 225,752 — 225,752
Capital expenditures 41,845 317,271 1,941 12,923 373,980 — 373,980
Provision for credit and lease residual losses
on finance subsidiaries-receivables ¥0,000,0—.¥0,000,0—.¥0,050,638 ¥000,0—.¥0,050,638 ¥000,0(—.¥0,050,638
As of and for the year ended March 31, 2006
Yen (millions)
Financial Power Product
Motorcycle Automobile Services and Other Segment Reconciling
Business Business Business Businesses Total Items Consolidated
Net sales and other operating revenue:
External customers ¥1,225,812 ¥8,004,694 ¥306,869 ¥370,621 ¥9,907,996 ¥000,0(—.¥9,907,996
Intersegment — — 4,068 11,941 16,009 (16,009) —
Total 1,225,812 8,004,694 310,937 382,562 9,924,005 (16,009) 9,907,996
Cost of sales, SG&A and R&D expenses 1,127,157 7,492,257 220,352 353,350 9,193,116 (16,009) 9,177,107
Gain on transfer of the substitutional portion
of the Employee’s Pension Funds 15,319 115,935 — 6,762 138,016 — 138,016
Segment income 113,974 628,372 90,585 35,974 868,905 — 868,905
Equity in income of affiliates 30,700 67,439 — 1,466 99,605 — 99,605
Assets 1,006,308 4,843,148 5,008,718 294,170 11,152,344 (520,944) 10,631,400
Investments in affiliates 87,041 304,477 — 13,194 404,712 — 404,712
Depreciation and amortization 30,232 222,165 771 9,057 262,225 — 262,225
Capital expenditures 52,246 392,934 1,316 11,345 457,841 — 457,841
Provision for credit and lease residual losses
on finance subsidiaries-receivables ¥0,000,0—.¥0,000,0—.¥036,153 ¥000,0—.¥0,036,153 ¥000,0(—.¥0,036,153