Honda 2007 Annual Report Download - page 14
Download and view the complete annual report
Please find page 14 of the 2007 Honda annual report below. You can navigate through the pages in the report by either clicking on the pages listed below, or by using the keyword search tool below to find specific information within the annual report.-
 1
1 -
2
-
3
-
 4
4 -
 5
5 -
 6
6 -
 7
7 -
 8
8 -
 9
9 -
 10
10 -
 11
11 -
 12
12 -
 13
13 -
 14
14 -
 15
15 -
 16
16 -
 17
17 -
 18
18 -
 19
19 -
 20
20 -
 21
21 -
 22
22 -
 23
23 -
 24
24 -
25
-
26
-
27
-
28
-
29
-
30
-
31
-
32
-
33
-
34
-
35
-
36
-
37
-
38
-
39
-
40
-
41
-
42
-
43
-
44
-
45
-
46
-
47
-
48
-
49
-
50
-
51
-
52
-
53
-
54
-
55
-
56
-
57
-
58
-
59
-
60
-
61
-
62
-
63
-
64
-
65
-
66
-
67
-
68
-
69
-
70
-
71
-
72
-
73
-
74
-
75
-
76
-
77
-
78
-
79
-
80
-
81
-
82
-
83
-
84
-
85
-
86
-
87
-
88
-
89
-
90
-
91
-
92
-
93
-
94
-
95
-
96
-
97
-
98
-
99
-
100
-
101
-
102
-
103
-
104
-
105
-
106
-
107
-
108
-
109
-
110
-
111
-
112
-
113
-
114
-
115
-
116
-
117
-
118
-
119
-
120
-
121
-
122
-
123
-
124
-
125
-
126
-
127
-
128
-
129
-
130
-
131
-
132
-
133
-
134
-
135
-
136
 |
 |

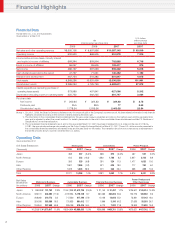
Summary of Operating Results by Business
Revenue from unaffiliated customers increased 11.8%, to ¥1,370.6 billion, from the
previous fiscal year, due mainly to increased unit sales and the positive impact of
currency translation effects. Operating income decreased 11.7 %, to ¥100.6 billion,
from the previous fiscal year, due mainly to increased SG&A expenses, increased R&D
expenses and the gain on the return of the substitutional portion of employees’ pen-
sion funds to the Japanese government recorded in fiscal 2006. This contributed to
offsetting the positive impact of increased profit attributable to higher revenue and the
currency effects that were caused by the depreciation of the Japanese yen.
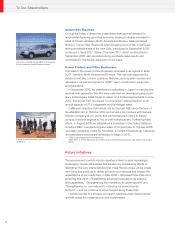
Revenue from unaffiliated customers increased 11.0%, to ¥8,889.0 billion, due to increased
unit sales and the positive impact of currency translation effects. Operating income
decreased 4.6%, to ¥599.5 billion, due mainly to the negative impact of changes in the
model mix, substantially increased raw material costs, increased SG&A expenses,
increased R&D expenses and the gain on the return of the substitutional portion of
employees’ pension funds to the Japanese government recorded in fiscal 2006, which
offset the positive impacts of increased profit attributable to higher revenue, continuing cost
reduction effects and the currency effects caused by the depreciation of the Japanese yen.
Revenue from unaffiliated customers in power product and other businesses increased
12.7%, to ¥417.7 billion, due mainly to increased unit sales of power products and the
positive impact of currency translation effects. Operating income was ¥36.1 billion, an
increase of 0.6% from the previous fiscal year, due mainly to the positive impact of
increased profit attributable to higher revenue and the currency effects caused by the
depreciation of the Japanese yen, which offset the negative impact of the increased
SG&A expenses and the gain on the return of the substitutional portion of employees’
pension funds to the Japanese government that was recorded in fiscal 2006.
Revenue from unaffiliated customers in our financial services business increased
33.5%, to ¥409.7 billion. Operating income increased 27.6%, to ¥115.5 billion,
benefiting from increased profit attributable to higher revenue and positive impact of
currency effects caused by the depreciation of the Japanese yen, despite higher
interest rates to raise funds.
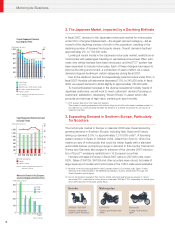
Motorcycle Business
Automobile Business
Power Product and Other Businesses
Financial Services Business
Review of Operations
(Year ended March 31, 2007)
12
Net Sales ¥1,370.6 billion (11.8%)
Operating Income ¥100.6 billion (–11.7%)
Net Sales ¥8,889.0 billion (11.0%)
Operating Income ¥599.5 billion (–4.6%)
Net Sales ¥417.7 billion (12.7%)
Operating Income ¥36.1 billion (0.6%)
Net Sales ¥409.7 billion (33.5%)
Operating Income ¥115.5 billion (27.6%)