Honda 2007 Annual Report Download - page 15
Download and view the complete annual report
Please find page 15 of the 2007 Honda annual report below. You can navigate through the pages in the report by either clicking on the pages listed below, or by using the keyword search tool below to find specific information within the annual report.-
 1
1 -
2
-
3
-
4
-
 5
5 -
 6
6 -
 7
7 -
 8
8 -
 9
9 -
 10
10 -
 11
11 -
 12
12 -
 13
13 -
 14
14 -
 15
15 -
 16
16 -
 17
17 -
 18
18 -
 19
19 -
 20
20 -
 21
21 -
 22
22 -
 23
23 -
 24
24 -
 25
25 -
26
-
27
-
28
-
29
-
30
-
31
-
32
-
33
-
34
-
35
-
36
-
37
-
38
-
39
-
40
-
41
-
42
-
43
-
44
-
45
-
46
-
47
-
48
-
49
-
50
-
51
-
52
-
53
-
54
-
55
-
56
-
57
-
58
-
59
-
60
-
61
-
62
-
63
-
64
-
65
-
66
-
67
-
68
-
69
-
70
-
71
-
72
-
73
-
74
-
75
-
76
-
77
-
78
-
79
-
80
-
81
-
82
-
83
-
84
-
85
-
86
-
87
-
88
-
89
-
90
-
91
-
92
-
93
-
94
-
95
-
96
-
97
-
98
-
99
-
100
-
101
-
102
-
103
-
104
-
105
-
106
-
107
-
108
-
109
-
110
-
111
-
112
-
113
-
114
-
115
-
116
-
117
-
118
-
119
-
120
-
121
-
122
-
123
-
124
-
125
-
126
-
127
-
128
-
129
-
130
-
131
-
132
-
133
-
134
-
135
-
136
 |
 |

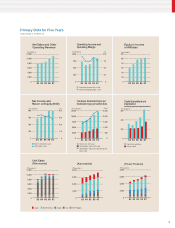
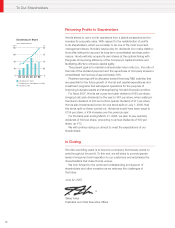
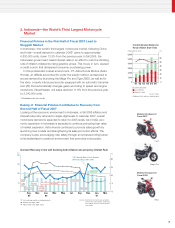
Percentage of Unit Sales by Region
337
Japan
503
North America
7,895
Asia 1,305
Other
Regions
Europe
329
(Thousands of units)
Net Sales/Operating Income
1,600
1,200
800
400
0
Yen (billions)
03 04 05 06 07
160
120
80
40
0
Yen (billions)
Net Sales (left scale)
Operating Income (right scale)
Years ended March 31
13
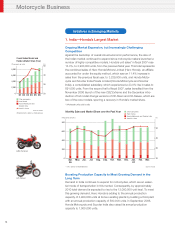
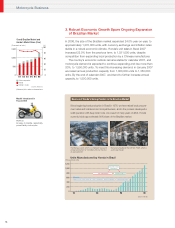
Unit Sales by Region
672
1,788
620
324
Japan
North America
Asia
248
Other
Regions
Europe
(Thousands of units)
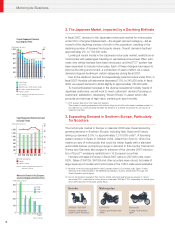
527
3,103
760
1,625
Japan North America
Asia
406
Other
Regions
Europe
(Thousands of units)
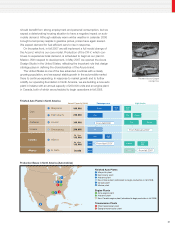
29.7%
32.1%
12.8%
11.0%
14.4%
10,369
thousand
Japan (3%)
Other Regions
(13%) North America (5%)
Europe (3%)
Asia (76%)
Year ended
March 31, 2007
29.7%
32.1%
12.8%
11.0%
14.4%
Other Regions
(7%) Japan
(18%)
North America
(49%)
Europe
(9%)
Asia
(17%)
3,652
thousand
Year ended
March 31, 2007
29.7%
32.1%
12.8%
11.0%
14.4%
Other Regions
(7%)
Japan
(8%)
North America
(48%)
Europe
(25%)
Asia
(12%)
6,421
thousand
Year ended
March 31, 2007
10,000
8,000
6,000
4,000
2,000
003 04 05 06 07
1,000
800
600
400
200
0
Yen (billions) Yen (billions)
Net Sales (left scale)
Operating Income (right scale)
Years ended March 31
500
400
300
200
100
0
03 04 05 06 07
50
40
30
20
10
0
Yen (billions) Yen (billions)
Net Sales (left scale)
Operating Income (right scale)
Years ended March 31
500
400
300
200
100
0
03 04 05 06 07
300
240
180
120
60
0
Yen (billions) Yen (billions)
Net Sales (left scale)
Operating Income (right scale)
Years ended March 31