Honda 2007 Annual Report Download - page 70
Download and view the complete annual report
Please find page 70 of the 2007 Honda annual report below. You can navigate through the pages in the report by either clicking on the pages listed below, or by using the keyword search tool below to find specific information within the annual report.-
 1
1 -
2
-
3
-
4
-
5
-
6
-
7
-
8
-
9
-
10
-
11
-
12
-
13
-
14
-
15
-
16
-
17
-
18
-
19
-
20
-
21
-
22
-
23
-
24
-
25
-
26
-
27
-
28
-
29
-
30
-
31
-
32
-
33
-
34
-
35
-
36
-
37
-
38
-
39
-
40
-
41
-
42
-
43
-
44
-
45
-
46
-
47
-
48
-
49
-
50
-
51
-
52
-
53
-
54
-
55
-
56
-
57
-
58
-
59
-
 60
60 -
 61
61 -
 62
62 -
 63
63 -
 64
64 -
 65
65 -
 66
66 -
 67
67 -
 68
68 -
 69
69 -
 70
70 -
 71
71 -
 72
72 -
 73
73 -
 74
74 -
 75
75 -
 76
76 -
 77
77 -
 78
78 -
 79
79 -
 80
80 -
81
-
82
-
83
-
84
-
85
-
86
-
87
-
88
-
89
-
90
-
91
-
92
-
93
-
94
-
95
-
96
-
97
-
98
-
99
-
100
-
101
-
102
-
103
-
104
-
105
-
106
-
107
-
108
-
109
-
110
-
111
-
112
-
113
-
114
-
115
-
116
-
117
-
118
-
119
-
120
-
121
-
122
-
123
-
124
-
125
-
126
-
127
-
128
-
129
-
130
-
131
-
132
-
133
-
134
-
135
-
136
 |
 |

68
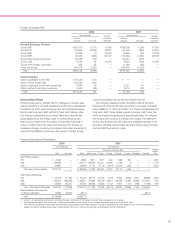
Long-Term Debt (including current maturities)
2006 2007
Yen (millions) Yen (millions)
Average
Expected maturity date
interest
Total Fair value Total Within 1 year 1-2 year 2-3 year 3-4 year 4-5 year Thereafter Fair value rate
Japanese yen bonds ¥0,231,200 228,555 ¥0,230,129 50,050 30,048 60,049 59,992 29,990 — 229,379 0.89%
Japanese yen medium-term notes
(Fixed rate)
374,624 374,887 367,900 114,000 103,400 70,500 62,000 18,000 — 368,425 0.80%
Japanese yen medium-term notes
(Floating rate)
100,696 101,328 85,200 24,500 38,000 19,700 — 3,000 — 85,525 0.77%
U.S. dollar medium-term notes
(Fixed rate)
336,512 334,377 354,500 35,409 107,539 88,147 58,764 41,135 23,506 357,121 4.52%
U.S. dollar medium-term notes
(Floating rate)
986,010 995,905 1,171,527 444,023 480,341 153,140 35,259 58,764 — 1,183,041 5.38%
U.S. dollar commercial paper
204,893 204,893 — — — — — — — — —
Loans and others—primarily fixed rate
302,710 303,969 471,896 107,427 129,322 94,169 101,964 35,837 3,177 471,384 4.14%
Total ¥2,536,645 2,543,914 ¥2,681,152 775,409 888,650 485,705 317,979 186,726 26,683 2,694,875 —
Interest Rate Swaps
2006 2007
Yen (millions) Yen (millions)
Notional
Expected maturity date
Average Average
principal Contract Contract Within receive pay
currency Receive/Pay amounts Fair value amounts 1 year 1-2 year 2-3 year 3-4 year 4-5 year Thereafter Fair value rate rate
JP¥ Float/Fix ¥0,001,455 (3) ¥0,005,858 150 4,582 326 800 — — —)1.01% 1.45%
US$ Float/Fix 2,712,564 39,965)2,933,563 1,195,922 964,636 633,560 120,409 19,036 — 8,661)5.35% 4.65%
Fix/Float 337,726 (6,426) 355,921 35,414 108,016 88,538 59,025 41,318 23,610 (1,878) 4.52% 5.50%
Float/Float 52,274 (311) 90,899 32,464 49,581 8,854 — — — (205) 5.20% 5.36%
CA$ Float/Fix 433,089 4,445)490,691 126,528 134,859 116,808 89,792 22,704 — 2,186)4.09% 3.94%
Fix/Float 71,663 (1,067) 75,961 6,817 18,832 18,677 6,373 25,196 66 (346) 3.95% 4.44%
Float/Float 185,057 (303) 195,325 74,134 64,383 37,207 14,701 4,834 66 (302) 4.04% 4.13%
GBP Float/Fix 54,927 32)48,314 16,408 10,321 11,377 10,208 — — 333)4.81% 4.90%
Fix/Float 8,993 —)1,931 1,563 368 — — — — —)5.11% 5.62%
Total ¥3,857,748 36,332)¥4,198,463 1,489,400 1,355,578 915,347 301,308 113,088 23,742 8,449)
Currency & Interest Rate Swaps
2006 2007
Yen (millions) Yen (millions)
Receiving Paying
Expected maturity date
Average Average
side side Contract Contract Within receive pay
currency currency Receive/Pay amounts Fair value amounts 1 year 1-2 year 2-3 year 3-4 year 4-5 year Thereafter Fair value rate rate
JP¥ US$ Fix/Float ¥393,389 (22,996) ¥386,064 117,555 109,379 76,071 64,740 18,319 — (21,728) 0.80% 5.61%
Float/Float 103,823 (5,520) 87,414 25,374 40,496 18,516 3,028 — — (4,940) 0.77% 5.58%
JP¥ CA$ Fix/Float 2,772 (610) 2,790 — — 2,790 — — — (628) 0.95% 4.75%
Other Other Fix/Float 70,041 736)70,387 — — — 70,387 — — 6,425 3.75% 5.50%
Float/Float 14,333 241)61,879 — 22,471 39,408 — — — 3,334 3.99% 5.42%
Total ¥584,358 (28,149) ¥608,534 142,929 172,346 136,785 138,155 18,319 — (17,537)
(Equity Price Risk)
Honda is exposed to equity price risk as a result of its holdings
of marketable equity securities. Marketable equity securities
included in Honda’s investment portfolio are held for purposes
other than trading, and are reported at fair value, with unreal-
ized gains or losses, net of deferred taxes included in accumu-
lated other comprehensive income (loss) in the stockholders’
equity section of the consolidated balance sheets. At March
31, 2006 and 2007, the estimated fair value of marketable
equity securities was ¥141.8 billion and ¥169.2 billion,
respectively.