Honda 2007 Annual Report Download - page 88
Download and view the complete annual report
Please find page 88 of the 2007 Honda annual report below. You can navigate through the pages in the report by either clicking on the pages listed below, or by using the keyword search tool below to find specific information within the annual report.-
 1
1 -
2
-
3
-
4
-
5
-
6
-
7
-
8
-
9
-
10
-
11
-
12
-
13
-
14
-
15
-
16
-
17
-
18
-
19
-
20
-
21
-
22
-
23
-
24
-
25
-
26
-
27
-
28
-
29
-
30
-
31
-
32
-
33
-
34
-
35
-
36
-
37
-
38
-
39
-
40
-
41
-
42
-
43
-
44
-
45
-
46
-
47
-
48
-
49
-
50
-
51
-
52
-
53
-
54
-
55
-
56
-
57
-
58
-
59
-
60
-
61
-
62
-
63
-
64
-
65
-
66
-
67
-
68
-
69
-
70
-
71
-
72
-
73
-
74
-
75
-
76
-
77
-
 78
78 -
 79
79 -
 80
80 -
 81
81 -
 82
82 -
 83
83 -
 84
84 -
 85
85 -
 86
86 -
 87
87 -
 88
88 -
 89
89 -
 90
90 -
 91
91 -
 92
92 -
 93
93 -
 94
94 -
 95
95 -
 96
96 -
 97
97 -
 98
98 -
99
-
100
-
101
-
102
-
103
-
104
-
105
-
106
-
107
-
108
-
109
-
110
-
111
-
112
-
113
-
114
-
115
-
116
-
117
-
118
-
119
-
120
-
121
-
122
-
123
-
124
-
125
-
126
-
127
-
128
-
129
-
130
-
131
-
132
-
133
-
134
-
135
-
136
 |
 |

86
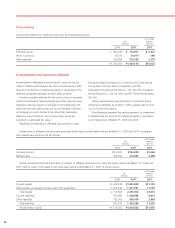
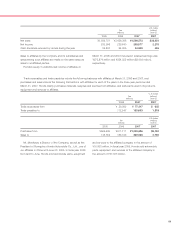
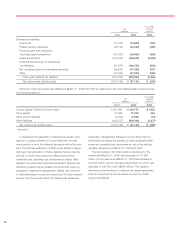
Finance subsidiaries-receivables, net, consisted of the following at March 31, 2006 and 2007:
U.S. dollars
Yen (millions)
(millions) (note 2)
2006 2007 2007
Direct financing leases ¥2,220,100 ¥1,892,566 $16,032
Retail 2,405,926 2,923,944 24,769
Wholesale 403,499 437,242 3,704
Term loans to dealers 14,337 14,916 126
Total finance receivables 5,043,862 5,268,668 44,631
Retained interests in the sold pools of finance receivables 94,634 88,110 746
5,138,496 5,356,778 45,377
Less:
Allowance for credit losses 35,316 35,020 297
Allowance for losses on lease residual values 37,774 33,928 287
Unearned interest income and fees 224,901 143,131 1,212
4,840,505 5,144,699 43,581
Less:
Finance receivables included in trade receivables, net 470,002 509,697 4,318
Finance receivables included in other assets, net 157,166 168,952 1,431
Finance subsidiaries-receivables, net 4,213,337 4,466,050 37,832
Less current portion 1,230,912 1,426,224 12,082
Noncurrent finance subsidiaries-receivables, net ¥2,982,425 ¥3,039,826 $25,750
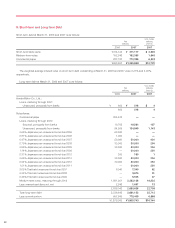
The following schedule shows the contractual maturities of finance receivables for each of the five years following March 31,
2007 and thereafter:
Yen
Years ending March 31
(millions)
2008 ¥1,978,483
2009 1,357,819
2010 1,030,733
2011 570,042
2012 258,659
After five years 72,932
3,290,185
Total ¥5,268,668
Net sales and other operating revenue and cost of sales include finance income and related cost of finance subsidiaries for
each of the years in the three-year period ended March 31, 2007 as follows:
U.S. dollars
Yen (millions)
(millions) (note 2)
2005 2006 2007 2007
Finance income ¥259,188 ¥310,937 ¥413,334 $3,501
Finance cost 54,815 115,636 188,844 1,600