Honda 2007 Annual Report Download - page 117
Download and view the complete annual report
Please find page 117 of the 2007 Honda annual report below. You can navigate through the pages in the report by either clicking on the pages listed below, or by using the keyword search tool below to find specific information within the annual report.-
 1
1 -
2
-
3
-
4
-
5
-
6
-
7
-
8
-
9
-
10
-
11
-
12
-
13
-
14
-
15
-
16
-
17
-
18
-
19
-
20
-
21
-
22
-
23
-
24
-
25
-
26
-
27
-
28
-
29
-
30
-
31
-
32
-
33
-
34
-
35
-
36
-
37
-
38
-
39
-
40
-
41
-
42
-
43
-
44
-
45
-
46
-
47
-
48
-
49
-
50
-
51
-
52
-
53
-
54
-
55
-
56
-
57
-
58
-
59
-
60
-
61
-
62
-
63
-
64
-
65
-
66
-
67
-
68
-
69
-
70
-
71
-
72
-
73
-
74
-
75
-
76
-
77
-
78
-
79
-
80
-
81
-
82
-
83
-
84
-
85
-
86
-
87
-
88
-
89
-
90
-
91
-
92
-
93
-
94
-
95
-
96
-
97
-
98
-
99
-
100
-
101
-
102
-
103
-
104
-
105
-
106
-
 107
107 -
 108
108 -
 109
109 -
 110
110 -
 111
111 -
 112
112 -
 113
113 -
 114
114 -
 115
115 -
 116
116 -
 117
117 -
 118
118 -
 119
119 -
 120
120 -
 121
121 -
 122
122 -
 123
123 -
 124
124 -
 125
125 -
 126
126 -
 127
127 -
128
-
129
-
130
-
131
-
132
-
133
-
134
-
135
-
136
 |
 |

115
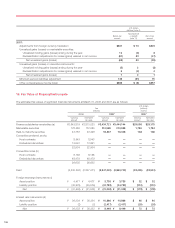
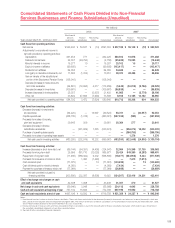
Supplemental Geographical Information
In addition to the disclosure required by U.S.GAAP, Honda provides the following supplemental information as required by
Japanese Securities and Exchange Law:
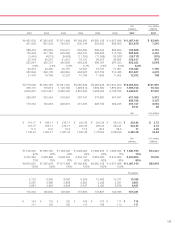
(1) Overseas sales and revenues based on the location of the customer
U.S. dollars
Yen (millions)
(millions) (note 2)
2005 2006 2007 2007
North America ¥4,575,076 ¥5,463,359 ¥5,980,876 $50,664
Europe 870,795 1,009,421 1,236,757 10,477
Asia 977,011 1,085,451 1,283,154 10,870
Other regions 528,018 655,721 905,163 7,668
Explanatory notes:
Major countries or regions in each geographic area:
North America United States, Canada, Mexico
Europe United Kingdom, Germany, France, Italy, Belgium
Asia Thailand, Indonesia, China, India
Other Regions Brazil, Australia
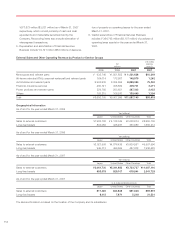
(2) Supplemental geographical information based on the location of the Company and its subsidiaries
As of and for the year ended March 31, 2005
Yen (millions)
North Other Reconciling
Japan America Europe Asia Regions Total Items Consolidated
Net sales and other
operating revenue:
External customers ¥1,983,182 ¥4,585,650 ¥0,858,936 ¥773,753 ¥448,584 ¥08,650,105 ¥0,(000,0—.¥8,650,105
Transfers between
geographic areas 2,155,756 119,904 184,136 86,810 17,373 2,563,979 (2,563,979) —
Total 4,138,938 4,705,554 1,043,072 860,563 465,957 11,214,084 (2,563,979) 8,650,105
Cost of sales, SG&A and
R&D expenses 3,954,039 4,384,400 1,001,829 799,871 432,764 10,572,903 (2,553,718) 8,019,185
Gain on transfer of the substitutional
portion of the Employees’ Pension
Funds — — — — — — — —
Operating income 184,899 321,154 41,243 60,692 33,193 641,181 (10,261) 630,920
Assets 2,480,052 5,254,246 649,547 541,331 203,605 9,128,781 239,455 9,368,236
Long-lived assets ¥0,894,065 ¥0,502,284 ¥0,118,339 ¥121,095 ¥047,429 ¥01,683,212 ¥0,(000,0—.¥1,683,212