Honda 2007 Annual Report Download - page 5
Download and view the complete annual report
Please find page 5 of the 2007 Honda annual report below. You can navigate through the pages in the report by either clicking on the pages listed below, or by using the keyword search tool below to find specific information within the annual report.-
 1
1 -
 2
2 -
 3
3 -
 4
4 -
 5
5 -
 6
6 -
 7
7 -
 8
8 -
 9
9 -
 10
10 -
 11
11 -
 12
12 -
 13
13 -
 14
14 -
 15
15 -
 16
16 -
17
-
18
-
19
-
20
-
21
-
22
-
23
-
24
-
25
-
26
-
27
-
28
-
29
-
30
-
31
-
32
-
33
-
34
-
35
-
36
-
37
-
38
-
39
-
40
-
41
-
42
-
43
-
44
-
45
-
46
-
47
-
48
-
49
-
50
-
51
-
52
-
53
-
54
-
55
-
56
-
57
-
58
-
59
-
60
-
61
-
62
-
63
-
64
-
65
-
66
-
67
-
68
-
69
-
70
-
71
-
72
-
73
-
74
-
75
-
76
-
77
-
78
-
79
-
80
-
81
-
82
-
83
-
84
-
85
-
86
-
87
-
88
-
89
-
90
-
91
-
92
-
93
-
94
-
95
-
96
-
97
-
98
-
99
-
100
-
101
-
102
-
103
-
104
-
105
-
106
-
107
-
108
-
109
-
110
-
111
-
112
-
113
-
114
-
115
-
116
-
117
-
118
-
119
-
120
-
121
-
122
-
123
-
124
-
125
-
126
-
127
-
128
-
129
-
130
-
131
-
132
-
133
-
134
-
135
-
136
 |
 |

3
12,000
10,000
8,000
6,000
4,000
2,000
0
03 04 05 06 07
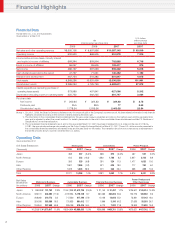
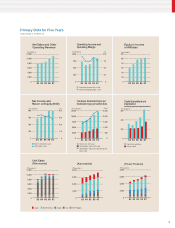
Net Sales and Other
Operating Revenue
Yen (billions)
1,000
750
500
250
0
10.0
7.5
5.0
2.5
0
03 04 05 06 07
(%)
Operating Income and
Operating Margin
Yen (billions)
Operating Income (left scale)
Operating Margin (right scale)
600
450
300
150
0
20.0
15.0
10.0
5.0
0
03 04 05 06 07
Net Income and
Return on Equity (ROE)
Net Income (left scale)
ROE (right scale)
(%)
Yen (billions)
12,000
10,000
8,000
6,000
4,000
2,000
0
03 04 05 06 07
Unit Sales
[Motorcycles]
(Thousands)
4,000
3,000
2,000
1,000
0
03 04 05 06 07
[Automobiles]
(Thousands)
8,000
6,000
4,000
2,000
003 04 05 06 07
[Power Products]
(Thousands)
12,500
10,000
7,500
5,000
2,500
0
2,500
2,000
1,500
1,000
500
0
03 04 05 06 07
Total Assets (left scale)
Stockholders’ Equity (left scale)
Stockholders’ Equity per Common Share
(right scale)
(Yen)
Total Assets, Stockholders’ Equity and
Stockholders’ Equity per Common Share
Yen (billions)
600
400
200
0
03 04 05 06 07
Capital Expenditure
Depreciation
Capital Expenditure and
Depreciation
(excluding property on operating leases)
Yen (billions)
120
100
80
60
40
20
003 04 05 06 07
Equity in Income
of Affiliates
Yen (billions)
Japan North America Europe Asia Other Regions
Primary Data for Five Years
Years ended or at March 31