Honda 2007 Annual Report Download - page 67
Download and view the complete annual report
Please find page 67 of the 2007 Honda annual report below. You can navigate through the pages in the report by either clicking on the pages listed below, or by using the keyword search tool below to find specific information within the annual report.-
 1
1 -
2
-
3
-
4
-
5
-
6
-
7
-
8
-
9
-
10
-
11
-
12
-
13
-
14
-
15
-
16
-
17
-
18
-
19
-
20
-
21
-
22
-
23
-
24
-
25
-
26
-
27
-
28
-
29
-
30
-
31
-
32
-
33
-
34
-
35
-
36
-
37
-
38
-
39
-
40
-
41
-
42
-
43
-
44
-
45
-
46
-
47
-
48
-
49
-
50
-
51
-
52
-
53
-
54
-
55
-
56
-
 57
57 -
 58
58 -
 59
59 -
 60
60 -
 61
61 -
 62
62 -
 63
63 -
 64
64 -
 65
65 -
 66
66 -
 67
67 -
 68
68 -
 69
69 -
 70
70 -
 71
71 -
 72
72 -
 73
73 -
 74
74 -
 75
75 -
 76
76 -
 77
77 -
78
-
79
-
80
-
81
-
82
-
83
-
84
-
85
-
86
-
87
-
88
-
89
-
90
-
91
-
92
-
93
-
94
-
95
-
96
-
97
-
98
-
99
-
100
-
101
-
102
-
103
-
104
-
105
-
106
-
107
-
108
-
109
-
110
-
111
-
112
-
113
-
114
-
115
-
116
-
117
-
118
-
119
-
120
-
121
-
122
-
123
-
124
-
125
-
126
-
127
-
128
-
129
-
130
-
131
-
132
-
133
-
134
-
135
-
136
 |
 |

65
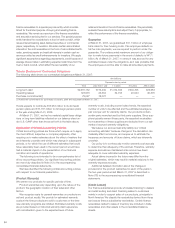
To determine the overall allowance for credit loss amount,
receivables are segmented into pools with common character-
istics such as product and collateral types, credit grades, and
original loan terms. For each of these pools, we estimate
losses primarily based on our historic loss experiences, delin-
quency rates, recovery rates and scale and composition of the
portfolio, taking factors into consideration such as changing
economic conditions and changes in operational policies and
procedures.
We believe our allowance for credit losses is a “critical
accounting estimate” because it requires us to make assump-
tions about inherently uncertain items such as future economic
trends, quality of finance subsidiaries-receivables and other
factors. We review the adequacy of the allowance for credit
losses, and the allowance for credit losses is maintained at an
amount that we deem sufficient to cover the estimated credit
losses incurred on our owned portfolio of finance receivables.
However, actual losses may differ from the original estimates as
a result of actual results varying from those assumed in our
estimates.
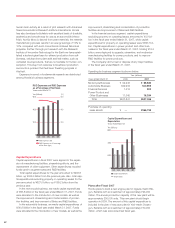
As an example of the sensitivity of the allowance calculation,
the following scenario demonstrates the impact that a deviation
in one of the primary factors estimated as a part of our allow-
ance calculation would have on the provision and allowance for
credit losses. If we had experienced a 10% increase in net
credit losses during fiscal 2007 in our North America portfolio,
the provision for fiscal 2007 and the allowance balance at the
end of fiscal 2007 would have increased by approximately ¥5.5
billion and ¥2.8 billion, respectively. Note that this sensitivity
analysis may be asymmetric, and are specific to the base
conditions in fiscal 2007.
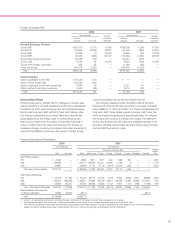
Additional Narrative of the Change in Credit Loss as Below
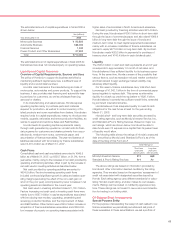
The following table shows information related to our credit loss experience in our North America portfolio:
Yen (billions)
Fiscal years ended March 31 2005 2006 2007
Charge-offs (net of recoveries) ¥0,023.1 ¥0,022.8 ¥0,026.2
Provision for credit losses 31.7 27.4 25.5
Allowance for credit losses 29.2 30.1 28.7
Ending receivable balance 3,613.6 4,166.5 4,351.8
Average receivable balance, net 3,333.5 3,938.2 4,330.8
Charge-offs as a % of average receivable balance 0.70% 0.58% 0.61%
Allowance as a % of ending receivable balance 0.81% 0.72% 0.66%
Fiscal Year 2007 Compared with Fiscal Year 2006
Net charge-offs in our North American portfolio increased by
¥3.4 billion, or 15%. Higher originations of finance receivables
due to business expansion in fiscal year 2006 compared to fis-
cal year 2005 resulted in higher charge-offs in fiscal year 2007.
The provision for credit losses decreased by ¥1.9 billion, or
7% and the allowance for credit losses decreased by ¥1.4 bil-
lion, or 5%. The decreases were due to lower estimates of
losses incurred as of March 31, 2007 even though finance
receivables increased.
(Losses on Lease Residual Values)
End-customers of leased vehicles typically have an option to
buy the leased vehicle for the contractual residual value of the
vehicle or to return the vehicle to our finance subsidiaries
through the dealer at the end of the lease term. Likewise, deal-
ers have the option to buy the vehicle returned by the cus-
tomer or to return the vehicle to our finance subsidiaries. The
likelihood that the leased vehicle will be purchased varies
depending on the difference between the actual market value
of the vehicle at the end of the lease term and the contractual
value determined at the inception of the lease. Our finance
subsidiaries in North America have historically accounted for all
leases as direct finance leases. However, starting in the year
ended March 31, 2007, some of the leases which do not
qualify for direct financing leases accounting treatment are
accounted for as operating leases.
We initially determine the contract residual values by using
our estimate of future used vehicle values, taking into consider-
ation data obtained from third parties. We are exposed to risk
of loss on the disposition of returned lease vehicles when the
proceeds from the sale of the vehicles are less than the con-
tractual residual values at the end of the lease term. We peri-
odically review the estimate of residual values. Downward
adjustments are made for declines in estimated residual values
that are deemed to be other-than-temporary. For direct financ-
ing leases, our finance subsidiaries in North America purchase
insurance to cover a portion of the estimated residual value.
The adjustments on the uninsured portion of the vehicle’s
residual value are recognized as a loss in the period in which
the estimate changed. For vehicle leases accounted for as
operating leases, adjustments to estimated residual values
result in changes to the remaining depreciation expense to be
recognized prospectively on a straight-line basis over the
remaining term of the lease.
The primary components in estimating losses on lease
residual values are the expected frequency of returns, or the
percentage of leased vehicles we expect to be returned by
customers at the end of the lease term, and the expected loss
severity, or the expected difference between the residual value
and the amount we receive through sales of returned vehicles
plus proceeds from insurance, if any. We estimate losses on
lease residual values by evaluating several different factors,
including trends in historical and projected used vehicle values
and general economic measures.