HTC 2012 Annual Report Download - page 99
Download and view the complete annual report
Please find page 99 of the 2012 HTC annual report below. You can navigate through the pages in the report by either clicking on the pages listed below, or by using the keyword search tool below to find specific information within the annual report.-
 1
1 -
2
-
3
-
4
-
5
-
6
-
7
-
8
-
9
-
10
-
11
-
12
-
13
-
14
-
15
-
16
-
17
-
18
-
19
-
20
-
21
-
22
-
23
-
24
-
25
-
26
-
27
-
28
-
29
-
30
-
31
-
32
-
33
-
34
-
35
-
36
-
37
-
38
-
39
-
40
-
41
-
42
-
43
-
44
-
45
-
46
-
47
-
48
-
49
-
50
-
51
-
52
-
53
-
54
-
55
-
56
-
57
-
58
-
59
-
60
-
61
-
62
-
63
-
64
-
65
-
66
-
67
-
68
-
69
-
70
-
71
-
72
-
73
-
74
-
75
-
76
-
77
-
78
-
79
-
80
-
81
-
82
-
83
-
84
-
85
-
86
-
87
-
88
-
 89
89 -
 90
90 -
 91
91 -
 92
92 -
 93
93 -
 94
94 -
 95
95 -
 96
96 -
 97
97 -
 98
98 -
 99
99 -
 100
100 -
 101
101 -
 102
102 -
 103
103 -
 104
104 -
 105
105 -
 106
106 -
 107
107 -
 108
108 -
 109
109 -
110
-
111
-
112
-
113
-
114
-
115
-
116
-
117
-
118
-
119
-
120
-
121
-
122
-
123
-
124
-
125
-
126
-
127
-
128
-
129
-
130
 |
 |
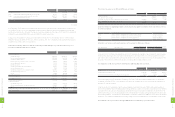
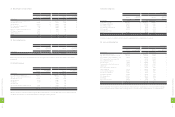
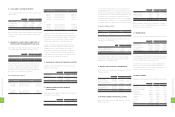
2011 2012
LIABILITIES AND STOCKHOLDERS' EQUITY NT$ NT$ US$ (Note 3)
CURRENT LIABILITIES
Notes and accounts payable (Note 27) $78,473,130 $73,618,197 $2,527,316
Income tax payable (Notes 2 and 24) 10,570,682 2,713,373 93,150
Accrued expenses (Notes 18 and 27) 46,171,290 37,376,493 1,283,137
Payable for purchase of equipment 812,240 1,471,529 50,518
Other current liabilities (Notes 2 and 19) 17,307,355 10,995,320 377,470
Total current liabilities 153,334,697 126,174,912 4,331,591
OTHER LIABILITIES
Guarantee deposits received 42,946 59,999 2,060
Total liabilities 153,377,643 126,234,911 4,333,651
STOCKHOLDERS' EQUITY (Note 21)
Capital stock - NT$10.00 par value
Authorized: 1,000,000 thousand shares
Issued and outstanding: 852,052 thousand shares in 2011 and 2012
Common stock 8,520,521 8,520,521 292,510
Capital surplus
Additional paid-in capital - issuance of shares in excess of par 14,809,608 14,809,608 508,415
Treasury stock transactions 1,730,458 1,730,458 59,407
Long-term equity investments 18,037 18,037 619
Merger 24,423 24,423 838
Expired stock options 37,068 37,068 1,273
Retained earnings
Legal reserve 10,273,674 16,471,254 565,459
Special reserve 580,856 - -
Accumulated earnings 75,762,315 53,677,474 1,842,750
Other equity
Cumulative translation adjustments (Note 2) 32,134 (1,057,559) (36,306)
Net losses not recognized as pension cost (293) (347) (12)
Unrealized valuation gains on financial instruments (Notes 2 and 26) 2,939 203,768 6,995
Treasury stock (Note 22) (10,365,144) (14,065,490) (482,869)
Equity attributable to stockholders of the parent 101,426,596 80,369,215 2,759,079
MINORITY INTEREST 992,724 - -
Total stockholders' equity 102,419,320 80,369,215 2,759,079
TOTAL $255,796,963 $206,604,126 $7,092,730
The accompanying notes are an integral part of the consolidated financial statements.
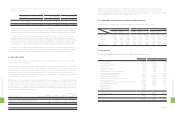
HTC CORPORATION AND SUBSIDIARIES
CONSOLIDATED BALANCE SHEETS
DECEMBER 31, 2011 AND 2012
(In Thousands, Except Par Value)
2011 2012
ASSETS NT$ NT$ US$ (Note 3)
CURRENT ASSETS
Cash and cash equivalents (Notes 2 and 5) $87,501,508 $53,878,067 $1,849,637
Financial assets at fair value through profit or loss (Notes 2, 6 and 26) 256,868 6,950 238
Available-for-sale financial assets - current (Notes 2, 7 and 26) 736,031 37,902 1,301
Held-to-maturity financial assets - current (Notes 2, 13 and 26) - 101,459 3,483
Hedging derivative assets - current (Notes 2, 8 and 26) - 204,519 7,021
Notes and accounts receivable, net (Notes 2, 9 and 27) 64,719,791 41,253,826 1,416,246
Other receivables - related parties (Note 27) 966 6,600,093 226,582
Other current financial assets (Note 10) 1,404,945 1,172,090 40,238
Inventories (Notes 2 and 11) 28,430,590 23,809,377 817,377
Prepayments (Note 12) 6,507,516 4,965,814 170,477
Deferred income tax assets - current (Notes 2 and 24) 2,246,196 3,530,215 121,193
Restricted assets - current (Note 28) - 3,645,860 125,162
Other current assets 1,055,480 452,808 15,545
Total current assets 192,859,891 139,658,980 4,794,500
LONG-TERM INVESTMENTS
Available-for-sale financial assets - non-current (Notes 2, 7 and 26) 279 197 7
Held-to-maturity financial assets - non-current (Notes 2, 13 and 26) 204,597 - -
Financial assets carried at cost - non-current (Notes 2, 14 and 26) 3,408,654 4,304,907 147,788
Investments accounted for by the equity method (Notes 2 and 15) 71,732 5,892,168 202,278
Total long-term investments 3,685,262 10,197,272 350,073
PROPERTIES (Notes 2, 16 and 27)
Cost
Land 7,614,167 7,615,546 261,442
Buildings and structures 5,999,807 11,817,745 405,704
Machinery and equipment 11,298,070 13,308,358 456,876
Molding equipment 172,632 - -
Computer equipment 765,177 943,107 32,377
Transportation equipment 7,710 7,038 242
Furniture and fixtures 368,025 452,511 15,535
Leased assets 6,730 2,765 95
Leasehold improvements 463,581 545,705 18,734
Total cost 26,695,899 34,692,775 1,191,005
Less: Accumulated depreciation (7,314,359) (9,273,494) (318,360)
Prepayments for construction-in-progress and equipment in transit 2,130,938 232,011 7,965
Properties, net 21,512,478 25,651,292 880,610
INTANGIBLE ASSETS (Notes 2 and 17)
Patents 11,152,098 9,180,674 315,173
Goodwill 10,812,564 1,534,366 52,675
Deferred pension cost 342 269 9
Other intangible assets 595,784 805,365 27,648
Total intangible assets 22,560,788 11,520,674 395,505
OTHER ASSETS
Refundable deposits 185,306 190,142 6,528
Deferred charges (Note 2) 763,516 897,164 30,800
Long-term receivable (Note 15) - 4,369,350 150,000
Deferred income tax assets - non-current (Notes 2 and 24) 3,675,521 4,427,776 152,005
Restricted assets - non-current (Note 28) 68,700 3,660 126
Other (Notes 2, 12 and 20) 10,485,501 9,687,816 332,583
Total other assets 15,178,544 19,575,908 672,042
TOTAL $255,796,963 $206,604,126 $7,092,730
1
9
4
8
FINANCIAL INFORMATION
1
9
5
8
FINANCIAL INFORMATION