HTC 2012 Annual Report Download - page 100
Download and view the complete annual report
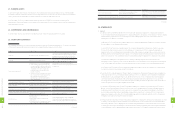
Please find page 100 of the 2012 HTC annual report below. You can navigate through the pages in the report by either clicking on the pages listed below, or by using the keyword search tool below to find specific information within the annual report.-
 1
1 -
2
-
3
-
4
-
5
-
6
-
7
-
8
-
9
-
10
-
11
-
12
-
13
-
14
-
15
-
16
-
17
-
18
-
19
-
20
-
21
-
22
-
23
-
24
-
25
-
26
-
27
-
28
-
29
-
30
-
31
-
32
-
33
-
34
-
35
-
36
-
37
-
38
-
39
-
40
-
41
-
42
-
43
-
44
-
45
-
46
-
47
-
48
-
49
-
50
-
51
-
52
-
53
-
54
-
55
-
56
-
57
-
58
-
59
-
60
-
61
-
62
-
63
-
64
-
65
-
66
-
67
-
68
-
69
-
70
-
71
-
72
-
73
-
74
-
75
-
76
-
77
-
78
-
79
-
80
-
81
-
82
-
83
-
84
-
85
-
86
-
87
-
88
-
89
-
 90
90 -
 91
91 -
 92
92 -
 93
93 -
 94
94 -
 95
95 -
 96
96 -
 97
97 -
 98
98 -
 99
99 -
 100
100 -
 101
101 -
 102
102 -
 103
103 -
 104
104 -
 105
105 -
 106
106 -
 107
107 -
 108
108 -
 109
109 -
 110
110 -
111
-
112
-
113
-
114
-
115
-
116
-
117
-
118
-
119
-
120
-
121
-
122
-
123
-
124
-
125
-
126
-
127
-
128
-
129
-
130
 |
 |

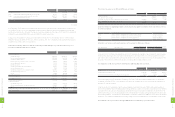
2011 2012
NT$ NT$ US$ (Note 3)
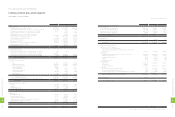
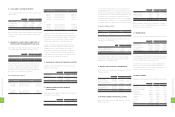
NON-OPERATING EXPENSES AND LOSSES
Interest expense $30,979 $1,715 $59
Loss on equity-method investments (Notes 2 and 15) 3,961 - -
Losses on disposal of properties 465 6,395 220
Loss on sale of investments, net (Notes 2 and 15) - 165,184 5,671
Impairment losses (Notes 2, 14, 15 and 17) 18,608 1,313,353 45,087
Other 93,331 122,912 4,219
Total non-operating expenses and losses 147,344 1,609,559 55,256
INCOME BEFORE INCOME TAX 71,423,687 19,450,458 667,736
INCOME TAX (Notes 2 and 24) (9,124,639) (1,861,272) (63,898)
NET INCOME $62,299,048 $17,589,186 $603,838
ATTRIBUTABLE TO
Stockholders of the parent $61,975,796 $16,780,968 $576,092
Minority interest 323,252 808,218 27,746
$62,299,048 $17,589,186 $603,838
2011 2012
Before
Income Tax
After
Income Tax
Before
Income Tax
After
Income Tax
NT$ NT$ NT$ US$ (Note 3) NT$ US$ (Note 3)
BASIC EARNINGS PER SHARE (Note 25) $82.63 $73.32 $20.34 $0.70 $20.17 $0.69
DILUTED EARNINGS PER SHARE (Note 25) $81.05 $71.91 $20.25 $0.70 $20.08 $0.69
The accompanying notes are an integral part of the consolidated financial statements.
(Concluded)
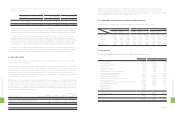
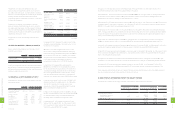
HTC CORPORATION AND SUBSIDIARIES
CONSOLIDATED STATEMENTS OF INCOME
YEARS ENDED DECEMBER 31, 2011 AND 2012
(Continued)
2011 2012
NT$ NT$ US$ (Note 3)
REVENUES (Notes 2 and 27)
Sales $466,488,311 $287,063,137 $9,854,892
Sales returns and allowances (2,609,461) (4,148,451) (142,417)
Net sales 463,878,850 282,914,686 9,712,475
Other operating revenues 1,915,923 6,105,489 209,602
Total revenues 465,794,773 289,020,175 9,922,077
COST OF REVENUES (Notes 2, 11, 23 and 27) 333,997,246 216,095,098 7,418,555
GROSS PROFIT 131,797,527 72,925,077 2,503,522
OPERATING EXPENSES (Notes 23 and 27)
Selling and marketing 40,088,802 32,387,932 1,111,879
General and administrative 6,626,010 6,227,469 213,789
Research and development 16,294,948 15,489,969 531,772
Total operating expenses 63,009,760 54,105,370 1,857,440
OPERATING INCOME 68,787,767 18,819,707 646,082
NON-OPERATING INCOME AND GAINS
Interest income (Note 27) 701,724 617,635 21,204
Gain on equity-method investments (Notes 2 and 15) - 387,478 13,302
Gain on sale of investments, net 29 - -
Exchange gains, net (Note 2) 1,520,643 666,883 22,894
Valuation gains on financial instruments, net (Notes 2 and 6) 256,868 17,417 597
Other (Note 27) 304,000 550,897 18,913
Total non-operating income and gains 2,783,264 2,240,310 76,910
(In Thousands, Except Earnings Per Share)
1
9
6
8
FINANCIAL INFORMATION
1
9
7
8
FINANCIAL INFORMATION