HTC 2012 Annual Report Download - page 94
Download and view the complete annual report
Please find page 94 of the 2012 HTC annual report below. You can navigate through the pages in the report by either clicking on the pages listed below, or by using the keyword search tool below to find specific information within the annual report.-
 1
1 -
2
-
3
-
4
-
5
-
6
-
7
-
8
-
9
-
10
-
11
-
12
-
13
-
14
-
15
-
16
-
17
-
18
-
19
-
20
-
21
-
22
-
23
-
24
-
25
-
26
-
27
-
28
-
29
-
30
-
31
-
32
-
33
-
34
-
35
-
36
-
37
-
38
-
39
-
40
-
41
-
42
-
43
-
44
-
45
-
46
-
47
-
48
-
49
-
50
-
51
-
52
-
53
-
54
-
55
-
56
-
57
-
58
-
59
-
60
-
61
-
62
-
63
-
64
-
65
-
66
-
67
-
68
-
69
-
70
-
71
-
72
-
73
-
74
-
75
-
76
-
77
-
78
-
79
-
80
-
81
-
82
-
83
-
 84
84 -
 85
85 -
 86
86 -
 87
87 -
 88
88 -
 89
89 -
 90
90 -
 91
91 -
 92
92 -
 93
93 -
 94
94 -
 95
95 -
 96
96 -
 97
97 -
 98
98 -
 99
99 -
 100
100 -
 101
101 -
 102
102 -
 103
103 -
 104
104 -
105
-
106
-
107
-
108
-
109
-
110
-
111
-
112
-
113
-
114
-
115
-
116
-
117
-
118
-
119
-
120
-
121
-
122
-
123
-
124
-
125
-
126
-
127
-
128
-
129
-
130
 |
 |

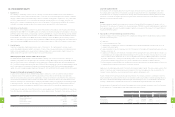
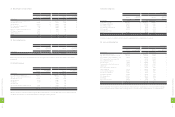
(5) Other Receivable
December 31
2011 2012
Amount % to Total
Other Receivable Amount % to Total
Other Receivable
Related Party NT$ NT$ US$ (Note 3)
Beats Electronics, LLC $- - $6,600,093 $226,582 86
HTC America Inc. 74,103 7 18,147 623 -
HTC EUROPE CO., LTD. 2,129 - 14,543 499 -
Others 2,845 - 941 32 -
$79,077 7 $6,633,724 $227,736 86
For details of other receivable from Beats Electronics, LLC, please refer to Loan section of Note 26.
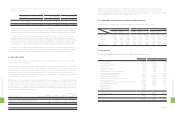
(6) Prepaid Expenses
December 31
2011 2012
Amount % to Total
Prepayment Amount % to Total
Prepayment
Related Party NT$ NT$ US$ (Note 3)
One & Company Design $- - $3,840 $132 -
HTC America Innovation Inc. 378,488 5 - - -
HTC India Private Limited 73,015 2 - - -
Others 95,964 - - - -
$547,467 7 $3,840 $132 -
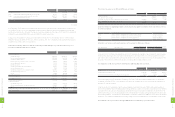
(7) Accrued Expenses
December 31
2011 2012
Amount % to Total
Accrued Expenses Amount % to Total
Accrued Expenses
Related Party NT$ NT$ US$ (Note 3)
HTC EUROPE CO., LTD. $770,897 2 $830,891 $28,525 3
High Tech Computer Asia Pacific Pte. Ltd. 422,582 1 227,614 7,814 1
HTC America Innovation Inc. 342,567 1 197,472 6,779 1
HTC (Australia and New Zealand) PTY. Ltd. 126,514 - 130,971 4,496 1
HTC HK, Limited 402,238 1 66,001 2,266 -
HTC Middle East FZ-LLC - - 57,963 1,990 -
Communication Global Certification Inc. 34,151 - 55,892 1,919 -
HTC Communication Canada, Ltd. 9,116 - 54,319 1,865 -
HTC India Private Limited 284,645 1 53,844 1,848 -
ABAXIA SAS 32,727 - 49,142 1,687 -
HTC (Thailand) Limited 134,981 - 42,602 1,463 -
HTC BRASIL - - 38,458 1,320 -
PT. High Tech Computer Indonesia 778 - 29,770 1,022 -
Saffron Digital Ltd. 35,573 - 15,774 541 -
HTC Nordic ApS 26,012 - 8,146 280 -
HTC Belgium BVBA/SPRL 80,265 - 7,541 259 -
HTC Innovation Limited 23,866 - 3,712 127 -
HTC Cultural and Educational Foundation 217,800 1 - - -
Others 82,254 - 83,012 2,850 -
$3,026,966 7 $1,953,124 $67,051 6
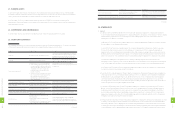
2. Major transactions with related parties are summarized below:
(1) Purchases of Inventories and Services
December 31
2011 2012
Amount % to Total
Net Purchases Amount % to Total
Net Purchases
Related Party NT$ NT$ US$ (Note 3)
HTC Electronics (Shanghai) Co., Ltd. $1,217,889 1 $1,710,137 $58,709 1
VIA Telecom Company Limited - - 63,675 2,186 -
Chander Electronics Corp. 172,540 - - - -
$1,390,429 1 $1,773,812 $60,895 1
Terms of payment and purchase prices for both related and third parties were similar.
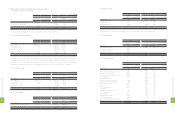
(2) Sales and Services Provided
2011 2012
Amount % to Total Revenues Amount % to Total Revenues
Related Party NT$ NT$ US$ (Note 3)
HTC America Inc. $201,020,041 44 $53,286,601 $1,829,332 20
HTC Communication Co., Ltd. 20,728,859 5 46,501,980 1,596,415 17
HTC NIPPON Corporation 780 - 4,261,905 146,311 1
Faith Hope & Love Limited - - 2,236,688 76,786 1
Employees’ Welfare Committee 52,540 - 220,037 7,554 -
Others 43,529 - 128,247 4,403 -
$221,845,749 49 $106,635,458 $3,660,801 39
The selling prices for products sold to related parties were similar to those sold to third parties, except for HTC America Inc., HTC
Communication Co., Ltd., HTC Employees' Welfare Committee and HTC NIPPON Corporation. The selling prices for products
sold to Faith Hope & Love Limited have no comparison with those sold to third parties. The collection terms for products sold to
related parties were similar to those for sales to third parties, except HTC America Inc. and Faith Hope & Love Limited.
(3) Accounts Receivable
December 31
2011 2012
Amount % to Total
Accounts Receivable Amount % to Total
Accounts Receivable
Related Party NT$ NT$ US$ (Note 3)
HTC America Inc. $29,333,501 44 $11,604,323 $398,377 28
HTC Communication Co., Ltd. 3,600,517 6 4,399,167 151,024 11
HTC NIPPON Corporation 345 - 3,179,837 109,164 8
Faith Hope & Love Limited - - 218,468 7,500 -
Others 42,906 - 66,335 2,277 -
$32,977,269 50 $19,468,130 $668,342 47
(4) Accounts Payable
December 31
2011 2012
Amount % to Total
Accounts Payable Amount % to Total
Accounts Payable
Related Party NT$ NT$ US$ (Note 3)
HTC Electronics (Shanghai) Co., Ltd. $3,639,231 5 $2,883,716 $98,998 4
VIA Telecom Company Limited - - 19,269 662 -
$3,639,231 5 $2,902,985 $99,660 4
1
8
4
8
FINANCIAL INFORMATION
1
8
5
8
FINANCIAL INFORMATION