HTC 2012 Annual Report Download - page 56
Download and view the complete annual report
Please find page 56 of the 2012 HTC annual report below. You can navigate through the pages in the report by either clicking on the pages listed below, or by using the keyword search tool below to find specific information within the annual report.-
 1
1 -
2
-
3
-
4
-
5
-
6
-
7
-
8
-
9
-
10
-
11
-
12
-
13
-
14
-
15
-
16
-
17
-
18
-
19
-
20
-
21
-
22
-
23
-
24
-
25
-
26
-
27
-
28
-
29
-
30
-
31
-
32
-
33
-
34
-
35
-
36
-
37
-
38
-
39
-
40
-
41
-
42
-
43
-
44
-
45
-
 46
46 -
 47
47 -
 48
48 -
 49
49 -
 50
50 -
 51
51 -
 52
52 -
 53
53 -
 54
54 -
 55
55 -
 56
56 -
 57
57 -
 58
58 -
 59
59 -
 60
60 -
 61
61 -
 62
62 -
 63
63 -
 64
64 -
 65
65 -
 66
66 -
67
-
68
-
69
-
70
-
71
-
72
-
73
-
74
-
75
-
76
-
77
-
78
-
79
-
80
-
81
-
82
-
83
-
84
-
85
-
86
-
87
-
88
-
89
-
90
-
91
-
92
-
93
-
94
-
95
-
96
-
97
-
98
-
99
-
100
-
101
-
102
-
103
-
104
-
105
-
106
-
107
-
108
-
109
-
110
-
111
-
112
-
113
-
114
-
115
-
116
-
117
-
118
-
119
-
120
-
121
-
122
-
123
-
124
-
125
-
126
-
127
-
128
-
129
-
130
 |
 |

New Equipment / Facilities
Replacement / upgrade of equipment and facilities is critical to enhancing productivity and meeting rising market
demand.
5. Investment Diversification in Recent Years
HTC's direct investment strategy focuses on the industry segments that enhance HTC's core businesses and long-
term strategic developments. Evaluation analysis is based on industry dynamics, market competition, founding
team experience, business model and risk analysis. The final goal is to make key strategic investments (via minority
or control) in companies and industries that strengthen HTC's product and service offerings and its long-term
competitiveness
HTC made only one strategic investment in 2012. Magnet Systems, Inc. is located in Palo Alto, California with a next-
generation mobile enterprise software platform. Smartphone application services, increasingly widespread with the
advent of 4G, are likely to see increased growth as the mobile enterprise application market further integrates with
the smartphone. Through this strategic investment in Magnet, HTC aims to take full advantage of the resources and
opportunities of the mobile enterprise application market.
6. Competitive Advantages, Business Growth and Assessment of
Risks
1. Potential Factors That May Influence HTC's Competitiveness/Business Growth and
Related Countermeasures
Critical competitive factors in HTC's industry include: 1) product R&D and innovation capabilities, 2) strategic
partnerships with industry leaders and 3) accurate grasp of market trends. The following assesses HTC's
competitiveness in terms of factors deemed to support and detract from HTC achieving its business goals.
• Factors Favorable to HTC Growth
(1) Partnerships with Industry Leaders Help HTC Drive Industry Trends
HTC has always developed smartphone products in close cooperation with industry leaders such as Google®,
Microsoft®, Qualcomm® as well as the world's leading telecom operators. Examples include HTC's launch of
the world's first Windows Mobile smartphone and first Android smartphone. Our strong partnerships deliver
greater choice to consumers while continuing to drive industry innovation.
(2) Long-term Cooperative Relationships with Telecom Providers Keep HTC Abreast of Consumer Demand
HTC promotes products directly to mass-market consumers via long-term, unique relationships with the world's
largest telecommunications service providers that include the four big mobile operators in the United States, five
major operators in Europe and several fast growing carriers in Asia. These relationships not only keep HTC abreast
of user demand but also allow HTC to better tailor its products and services to the needs of each carrier partner.
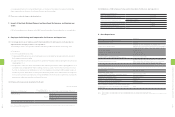
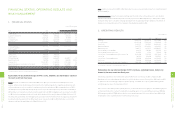
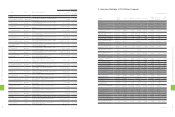
3. Cash Flows
1. Analysis of change in cash flow for the most recent fiscal year
Year
Item 2012 2011 %
Cash Flow Ratio (%) 18 58 (69)
Cash Flow Adequacy Ratio (%) 126 158 (20)
Cash Flow Reinvestment Ratio (%) (11) 53 (121)
Explanation and analysis of change
2012 revenue was down YoY, which meant net cash flow from operating activities saw a 74% decrease, with current
liabilities down 18% compared to 2011. As a result, the company's cash flow ratio decreased to 18%. Meanwhile, HTC
continued to invest in additional production capacity and office expansion to meet anticipated future demand
coupled with continued payout of a cash dividend based on historical rates, despite the deterioration in cash flow
from operating activities in 2012. This resulted in a lower cash adequacy ratio of 126%. The company's cash flow
reinvestment ratio fell and turned negative mainly because of the continued payment of a cash dividend and lower
cash inflow from operating activities in 2012, producing a negative denominator (net cash flow from operating
activities – cash dividends).
2. Cash flow analysis for the coming year
We expect our net cash flows from operating activities and ample cash on-hand can fully support capital
expenditures, cash dividends and all other cash needs in 2013.
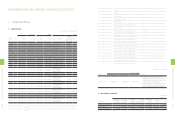
4. THE EFFECT ON FINANCIAL OPERATIONS OF MATERIAL CAPITAL
EXPENDITURES DURING THE MOST RECENT FISCAL YEAR
1. Review and analysis of material capital expenditures and funding sources
(1) Material capital expenditure and funding sources
Unit:NT$1,000
Planned items Actual or projected
sources of capital
Actual or projected
date of completion
Total capital
needed
(as of FY2012)
Actual or projected capital utilization
2010 2011 2012
Purchase and Installation
of Equipment / Facilities working capital 2010~2012 10,611,010 3,289,848 3,946,634 3,374,528
Plant/Building
Construction working capital 2010~2012 9,979,299 1,941,918 4,490,062 3,547,319
(2) Anticipated Benefits
New Plant/Building Construction
The new Taoyuan Headquarters campus and Taipei headquarters building are essential to expanding
production and providing HTC employees with an appropriate working environment.
1
0
8
6
FINANCIAL STATUS, OPERATING
RESULTS AND RISK MANAGEMENT
1
0
9
6
FINANCIAL STATUS, OPERATING
RESULTS AND RISK MANAGEMENT