HTC 2012 Annual Report Download - page 55
Download and view the complete annual report
Please find page 55 of the 2012 HTC annual report below. You can navigate through the pages in the report by either clicking on the pages listed below, or by using the keyword search tool below to find specific information within the annual report.-
 1
1 -
2
-
3
-
4
-
5
-
6
-
7
-
8
-
9
-
10
-
11
-
12
-
13
-
14
-
15
-
16
-
17
-
18
-
19
-
20
-
21
-
22
-
23
-
24
-
25
-
26
-
27
-
28
-
29
-
30
-
31
-
32
-
33
-
34
-
35
-
36
-
37
-
38
-
39
-
40
-
41
-
42
-
43
-
44
-
 45
45 -
 46
46 -
 47
47 -
 48
48 -
 49
49 -
 50
50 -
 51
51 -
 52
52 -
 53
53 -
 54
54 -
 55
55 -
 56
56 -
 57
57 -
 58
58 -
 59
59 -
 60
60 -
 61
61 -
 62
62 -
 63
63 -
 64
64 -
 65
65 -
66
-
67
-
68
-
69
-
70
-
71
-
72
-
73
-
74
-
75
-
76
-
77
-
78
-
79
-
80
-
81
-
82
-
83
-
84
-
85
-
86
-
87
-
88
-
89
-
90
-
91
-
92
-
93
-
94
-
95
-
96
-
97
-
98
-
99
-
100
-
101
-
102
-
103
-
104
-
105
-
106
-
107
-
108
-
109
-
110
-
111
-
112
-
113
-
114
-
115
-
116
-
117
-
118
-
119
-
120
-
121
-
122
-
123
-
124
-
125
-
126
-
127
-
128
-
129
-
130
 |
 |

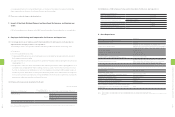
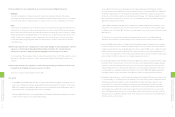
Debt: Liabilities decreased from 2011 to 2012, mainly due to lower revenues and related reductions in purchasing and
accounts payables.
Shareholders' Equity: A reduction in retained earnings was the result of the continued payout of a cash dividend
based on historical rates and reduced profits caused by lower revenue. Other adjustments to shareholders' equity
decreased mainly due to cumulative exchange rate adjustments recognized by foreign operations. The amount of
treasury stock increased because of the company's share buyback program in 2012.
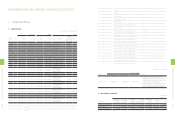
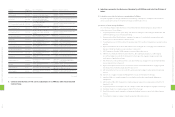
2. OPERATING RESULTS
Unit:NT$1,000
Item 2012 2011 Difference %
Revenues 289,020,175 465,794,773 (176,774,598) (38)
Cost of Revenues 216,095,098 333,997,246 (117,902,148) (35)
Gross Profit 72,925,077 131,797,527 (58,872,450) (45)
Operating Expenses 54,105,370 63,009,760 (8,904,390) (14)
Operating Income 18,819,707 68,787,767 (49,968,060) (73)
Non-operating Income and Gains 2,240,310 2,783,264 (542,954) (20)
Non-operating Expenses and Losses 1,609,559 147,344 1,462,215 992
Income From Continuing Operations Before Income Tax 19,450,458 71,423,687 (51,973,229) (73)
Income Tax 1,861,272 9,124,639 (7,263,367) (80)
Income From Continuing Operations 17,589,186 62,299,048 (44,709,862) (72)
Net Income 17,589,186 62,299,048 (44,709,862) (72)
Net Income Attributable to Stockholders of the Parent 16,780,968 61,975,796 (45,194,828) (73)
* All numbers above are based on consolidated financial statements.
Explanations for any material changes in HTC's revenues, operating income, and pre-tax
income in the most recent two fiscal years
Intensifying competition in the world's mobile phone market led to lower revenue in 2012 compared to 2011.
Operating costs were reduced proportionally in line with the decline in revenue. Gross profit in 2012 was down 45%
vs. 2011 as a result of increasingly competitive product pricing. To maintain the scope of global marketing efforts
operating expenses were only reduced by 14% YoY.
HTC's revenue comes mainly from its primary business, income from interest, forex gain/loss, and valuation gain/loss
on financial instruments accounted for nearly all non-operating gain/loss; the overall difference between 2012 and
2011 was approximately NT$500 million reduction in non-operating income. Net income before tax in 2012 totaled
NT$19.5 billion, which was NT$52 billion lower than the previous year.
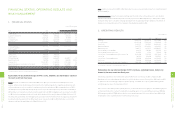
1. FINANCIAL STATUS
Unit:NT$ thousands
Item 2012 2011 Difference
Amount %
Current Assets 139,658,980 192,859,891 (53,200,911) (28)
Long-term Investments 10,197,272 3,685,262 6,512,010 177
Fixed Assets 25,651,292 21,512,478 4,138,814 19
Intangible Assets 11,520,674 22,560,788 (11,040,114) (49)
Other Assets 19,575,908 15,178,544 4,397,364 29
Total Assets 206,604,126 255,796,963 (49,192,837) (19)
Current Liabilities 126,174,912 153,334,697 (27,159,785) (18)
Long-term Liabilities - - - -
Other Liabilities 59,999 42,946 17,053 40
Total Liabilities 126,234,911 153,377,643 (27,142,732) (18)
Capital Stock 8,520,521 8,520,521 - -
Capital Surplus 16,619,594 16,619,594 - -
Retained Earnings 70,148,728 86,616,845 (16,468,117) (19)
Equity Adjustments (854,138) 34,780 (888,918) (2,556)
Treasury Stock (14,065,490) (10,365,144) (3,700,346) 36
Equity Attributable to Stockholders of the Parent 80,369,215 101,426,596 (21,057,381) (21)
Minority Interest - 992,724 (992,724) (100)
Total Stockholders' Equity 80,369,215 102,419,320 (22,050,105) (22)
* All numbers above are based on consolidated financial statements.
Explanations for any material changes in HTC's assets, liabilities, and shareholders' equity in
the most recent two fiscal years
Assets: The level of current assets decreased in 2012 vs. the 2011 level. This reduction was mainly due to lower
revenue, sustained cash dividend payouts and investments in additional production capacity, resulting in net cash
outflow and lower accounts receivables. Long-term investments were higher in 2012 compared to those of 2011. It
was mainly due to the partial disposal of Beats Electronic LLC, an investment previously classified as a subsidiary in
2011 and later as a long-term investment under the equity method in 2012. Intangible assets saw a reduction in 2012
vs. 2011, due to the regular amortization of assets with defined useful lives and the disposal of Beats Electronic LLC,
which required goodwill and other intangible assets associated with the investment to be recognized as a long-term
investment under the equity method. Other assets saw an increase from 2011 to 2012; mainly due to uncollected
sales proceeds from the partial disposal of Beats Electronic LLC.
FINANCIAL STATUS, OPERATING RESULTS AND
RISK MANAGEMENT
1
0
6
6
FINANCIAL STATUS, OPERATING
RESULTS AND RISK MANAGEMENT
1
0
7
6
FINANCIAL STATUS, OPERATING
RESULTS AND RISK MANAGEMENT