HTC 2012 Annual Report Download - page 77
Download and view the complete annual report
Please find page 77 of the 2012 HTC annual report below. You can navigate through the pages in the report by either clicking on the pages listed below, or by using the keyword search tool below to find specific information within the annual report.-
 1
1 -
2
-
3
-
4
-
5
-
6
-
7
-
8
-
9
-
10
-
11
-
12
-
13
-
14
-
15
-
16
-
17
-
18
-
19
-
20
-
21
-
22
-
23
-
24
-
25
-
26
-
27
-
28
-
29
-
30
-
31
-
32
-
33
-
34
-
35
-
36
-
37
-
38
-
39
-
40
-
41
-
42
-
43
-
44
-
45
-
46
-
47
-
48
-
49
-
50
-
51
-
52
-
53
-
54
-
55
-
56
-
57
-
58
-
59
-
60
-
61
-
62
-
63
-
64
-
65
-
66
-
 67
67 -
 68
68 -
 69
69 -
 70
70 -
 71
71 -
 72
72 -
 73
73 -
 74
74 -
 75
75 -
 76
76 -
 77
77 -
 78
78 -
 79
79 -
 80
80 -
 81
81 -
 82
82 -
 83
83 -
 84
84 -
 85
85 -
 86
86 -
 87
87 -
88
-
89
-
90
-
91
-
92
-
93
-
94
-
95
-
96
-
97
-
98
-
99
-
100
-
101
-
102
-
103
-
104
-
105
-
106
-
107
-
108
-
109
-
110
-
111
-
112
-
113
-
114
-
115
-
116
-
117
-
118
-
119
-
120
-
121
-
122
-
123
-
124
-
125
-
126
-
127
-
128
-
129
-
130
 |
 |

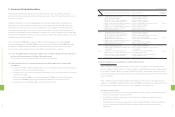
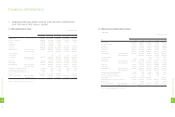
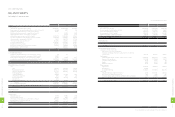
2011 2012
LIABILITIES AND STOCKHOLDERS' EQUITY NT$ NT$ US$ (Note 3)
CURRENT LIABILITIES
Notes and accounts payable $72,855,374 $71,227,584 $2,445,246
Accounts payable to related parties (Note 26) 3,639,231 2,902,985 99,660
Income tax payable (Notes 2 and 23) 9,653,090 1,424,006 48,886
Accrued expenses (Notes 17 and 26) 42,364,231 30,537,236 1,048,345
Payable for purchase of equipment (Note 26) 348,772 1,119,058 38,417
Other current liabilities (Notes 2, 18 and 26) 17,823,001 11,606,654 398,457
Total current liabilities 146,683,699 118,817,523 4,079,011
OTHER LIABILITIES
Guarantee deposits received 628 - -
Total liabilities 146,684,327 118,817,523 4,079,011
STOCKHOLDERS' EQUITY (Note 20)
Capital stock - NT$10.00 par value
Authorized: 1,000,000 thousand shares
Issued and outstanding: 852,052 thousand shares in 2011 and 2012
Common stock 8,520,521 8,520,521 292,510
Capital surplus
Additional paid-in capital - issuance of shares in excess of par 14,809,608 14,809,608 508,415
Treasury stock transactions 1,730,458 1,730,458 59,407
Long-term equity investments 18,037 18,037 619
Merger 24,423 24,423 838
Expired stock options 37,068 37,068 1,273
Retained earnings
Legal reserve 10,273,674 16,471,254 565,459
Special reserve 580,856 - -
Accumulated earnings 75,762,315 53,677,474 1,842,750
Other equity
Cumulative translation adjustments (Note 2) 32,134 (1,057,559) (36,306)
Net losses not recognized as pension cost (293) (347) (12)
Unrealized valuation gains on financial instruments (Notes 2, 8 and 25) 2,939 203,768 6,995
Treasury stock (Notes 2 and 21) (10,365,144) (14,065,490) (482,869)
Total stockholders' equity 101,426,596 80,369,215 2,759,079
TOTAL $248,110,923 $199,186,738 $6,838,090
The accompanying notes are an integral part of the financial statements.
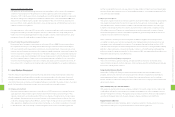
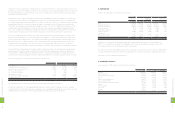
(In Thousands, Except Par Value)
HTC CORPORATION
BALANCE SHEETS
DECEMBER 31, 2011 AND 2012
2011 2012
ASSETS NT$ NT$ US$ (Note 3)
CURRENT ASSETS
Cash and cash equivalents (Notes 2 and 5) $78,872,320 $44,506,829 $1,527,922
Financial assets at fair value through profit or loss (Notes 2, 6 and 25) 256,868 6,950 238
Available-for-sale financial assets - current (Notes 2 and 7) 736,031 - -
Held-to-maturity financial assets - current (Notes 2 and 13) - 101,459 3,483
Hedging derivative assets - current (Notes 2, 8 and 25) - 204,519 7,021
Notes and accounts receivable, net (Notes 2 and 9) 32,039,776 19,743,763 677,804
Accounts receivable from related parties, net (Notes 2 and 26) 32,977,269 19,468,130 668,342
Other receivables - related parties (Note 26) 79,077 6,633,724 227,736
Other current financial assets (Note 10) 1,304,850 1,124,470 38,603
Inventories (Notes 2 and 11) 25,389,320 20,521,967 704,520
Prepayments (Notes 12 and 26) 6,473,372 4,154,949 142,640
Deferred income tax assets - current (Notes 2 and 23) 1,517,302 1,948,496 66,892
Restricted assets - current (Note 27) - 3,645,820 125,161
Other current assets 558,279 210,066 7,212
Total current assets 180,204,464 122,271,142 4,197,574
LONG-TERM INVESTMENTS
Available-for-sale financial assets - non-current (Notes 2 and 7) 279 197 7
Held-to-maturity financial assets - non-current (Notes 2 and 13) 204,597 - -
Financial assets carried at cost - non-current (Notes 2 and 14) 515,861 515,861 17,710
Investments accounted for by the equity method (Notes 2 and 15) 36,477,563 41,786,408 1,434,529
Prepayments for long-term investments (Notes 2 and 15) 579,485 349,688 12,005
Total long-term investments 37,777,785 42,652,154 1,464,251
PROPERTIES (Notes 2, 16 and 26)
Cost
Land 7,462,281 7,462,489 256,188
Buildings and structures 3,680,608 9,520,993 326,856
Machinery and equipment 7,100,072 8,732,565 299,789
Molding equipment 172,632 - -
Computer equipment 398,289 500,978 17,199
Transportation equipment 6,570 6,570 226
Furniture and fixtures 204,185 240,906 8,270
Leased assets 4,712 - -
Leasehold improvements 215,437 220,726 7,577
Total cost 19,244,786 26,685,227 916,105
Less: Accumulated depreciation (5,850,061) (6,958,391) (238,882)
Prepayments for construction-in-progress and equipment in transit 2,027,620 208,750 7,166
Properties, net 15,422,345 19,935,586 684,389
INTANGIBLE ASSETS
Patents (Note 2) 2,120,948 1,625,340 55,798
OTHER ASSETS
Refundable deposits 78,894 84,947 2,916
Deferred charges (Note 2) 120,593 91,810 3,152
Deferred income tax assets - non-current (Notes 2 and 23) 3,596,520 4,362,785 149,775
Restricted assets - non-current (Note 27) 63,900 - -
Other (Notes 2, 12 and 19) 8,725,474 8,162,974 280,235
Total other assets 12,585,381 12,702,516 436,078
TOTAL $248,110,923 $199,186,738 $6,838,090
1
5
0
8
FINANCIAL INFORMATION
1
5
1
8
FINANCIAL INFORMATION