HTC 2012 Annual Report Download - page 103
Download and view the complete annual report
Please find page 103 of the 2012 HTC annual report below. You can navigate through the pages in the report by either clicking on the pages listed below, or by using the keyword search tool below to find specific information within the annual report.-
 1
1 -
2
-
3
-
4
-
5
-
6
-
7
-
8
-
9
-
10
-
11
-
12
-
13
-
14
-
15
-
16
-
17
-
18
-
19
-
20
-
21
-
22
-
23
-
24
-
25
-
26
-
27
-
28
-
29
-
30
-
31
-
32
-
33
-
34
-
35
-
36
-
37
-
38
-
39
-
40
-
41
-
42
-
43
-
44
-
45
-
46
-
47
-
48
-
49
-
50
-
51
-
52
-
53
-
54
-
55
-
56
-
57
-
58
-
59
-
60
-
61
-
62
-
63
-
64
-
65
-
66
-
67
-
68
-
69
-
70
-
71
-
72
-
73
-
74
-
75
-
76
-
77
-
78
-
79
-
80
-
81
-
82
-
83
-
84
-
85
-
86
-
87
-
88
-
89
-
90
-
91
-
92
-
 93
93 -
 94
94 -
 95
95 -
 96
96 -
 97
97 -
 98
98 -
 99
99 -
 100
100 -
 101
101 -
 102
102 -
 103
103 -
 104
104 -
 105
105 -
 106
106 -
 107
107 -
 108
108 -
 109
109 -
 110
110 -
 111
111 -
 112
112 -
 113
113 -
114
-
115
-
116
-
117
-
118
-
119
-
120
-
121
-
122
-
123
-
124
-
125
-
126
-
127
-
128
-
129
-
130
 |
 |

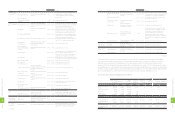
2011 2012
NT$ NT$ US$ (Note 3)
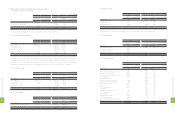
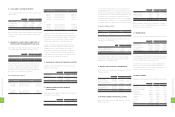
CASH FLOWS FROM FINANCING ACTIVITIES
Decrease in long-term bank loans ($24,376) $- $-
Increase in guarantee deposits received 28,987 17,053 585
Cash dividends (29,891,089) (33,249,085) (1,141,443)
Purchase of treasury stock (16,135,808) (3,700,346) (127,033)
Transfer of treasury stock to employees 4,113,821 - -
Increase (decrease) in minority interest 669,472 (1,459,370) (50,100)
Net cash used in financing activities (41,238,993) (38,391,748) (1,317,991)
EFFECT OF EXCHANGE RATE CHANGES ON CASH AND CASH EQUIVALENTS (65,975) 665,807 22,857
NET INCREASE (DECREASE) IN CASH AND CASH EQUIVALENTS 13,038,647 (33,623,441) (1,154,295)
CASH AND CASH EQUIVALENTS, BEGINNING OF YEAR 74,462,861 87,501,508 3,003,932
CASH AND CASH EQUIVALENTS, END OF YEAR $87,501,508 $53,878,067 $1,849,637
SUPPLEMENTAL CASH FLOW INFORMATION
Cash paid during the year
Interest $32,197 $1,715 $59
Income tax $7,877,290 $11,754,892 $403,546
NON-CASH INVESTING AND FINANCING ACTIVITIES
Transfer of retained earnings to stock dividends for distribution $403,934 $- $-
Transfer of assets leased to others to properties $50,828 $- $-
Retirement of treasury stock $8,509,336 $- $-
Transfer of accrued bonus to employees to stock dividends for distribution and
other capital surplus $4,245,851 $- $-
PURCHASE OF PROPERTIES
Cost of properties purchased $8,781,446 $6,921,847 $237,627
Increase in payables for the purchase of equipment (370,264) (659,289) (22,634)
Cash paid for the purchase of properties $8,411,182 $6,262,558 $214,993
ACQUISITION OF SUBSIDIARIES
Net cash outflow on the acquisition of a subsidiary $20,303,485 $45,021 $1,546
(Increase) decrease in other payable (92,756) 128,905 4,424
Cash paid for acquisition of subsidiaries $20,210,729 $173,926 $5,970
CASH RECEIVED FROM THE DISPOSAL OF A SUBSIDIARY
Proceeds of the sale of subsidiary $- $4,369,350 $150,000
Increase in long-term receivable - (4,369,350) (150,000)
Cash received from the disposal of a subsidiary $- $- $-
The accompanying notes are an integral part of the consolidated financial statements.
(Concluded)
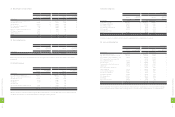
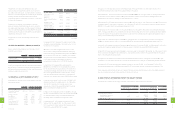
(In Thousands)
2011 2012
NT$ NT$ US$ (Note 3)
CASH FLOWS FROM OPERATING ACTIVITIES
Net income $62,299,048 $17,589,186 $603,838
Adjustments to reconcile net income to net cash provided by operating activities
Depreciation 1,564,225 2,222,517 76,299
Amortization 836,611 2,037,722 69,955
Compensation cost recognized for the transfer of treasury stock to
employees 1,788,270 - -
Amortization of premium on financial assets 3,349 3,138 108
Prepaid pension cost (24,878) (22,267) (764)
Loss (gain) on equity-method investments 3,961 (387,478) (13,302)
Losses on disposal of properties, net 465 6,395 220
Transfer of properties to expenses 324 30,501 1,047
(Gain) loss on sale of investments, net (29) 165,184 5,671
Unrealized gain on financial assets - (10,467) (359)
Impairment losses 18,608 1,313,353 45,087
Deferred income tax assets (2,504,033) (2,036,274) (69,905)
Net changes in operating assets and liabilities
Financial instruments at fair value through profit or loss 229,037 249,918 8,580
Notes and accounts receivable (2,124,055) 19,885,018 682,654
Other receivables- related parties - 966 33
Inventories (1,995,952) 2,707,400 92,945
Prepayments (3,834,892) (1,412,046) (48,476)
Other current assets (287,655) 195,668 6,717
Other current financial assets (622,371) 215,036 7,382
Other assets - others (7,784,602) 819,971 28,149
Notes and accounts payable 16,372,303 68,467 2,350
Income tax payable 3,751,382 (7,857,294) (269,741)
Accrued expenses 16,823,509 (6,481,923) (222,525)
Other current liabilities 3,994,726 (6,006,993) (206,221)
Net cash provided by operating activities 88,507,351 23,295,698 799,742
CASH FLOWS FROM INVESTING ACTIVITIES
Purchase of available-for-sale financial assets (490,000) - -
Proceeds of the sale of available-for-sale financial assets 200,029 829,071 28,462
Repayment of held-to-maturity financial assets - 100,000 3,433
Increase in financial assets carried at cost (2,300,272) (2,292,573) (78,704)
Acquisition of investments accounted for by the equity method (76,214) - -
Acquisition of subsidiaries (20,210,729) (173,926) (5,970)
Purchase of properties (8,411,182) (6,262,558) (214,993)
Proceeds of the sale of properties 580 38,683 1,328
Increase in refundable deposits (34,309) (13,718) (471)
Increase in deferred charges (574,267) (228,537) (7,846)
Loan to related parties - (6,600,093) (226,582)
Decrease (increase) in restricted assets 26,988 (3,580,820) (122,930)
Increase in intangible assets (2,294,360) (509,338) (17,486)
Loss of a subsidiary - (499,389) (17,144)
Net cash used in investing activities (34,163,736) (19,193,198) (658,903)
HTC CORPORATION AND SUBSIDIARIES
CONSOLIDATED STATEMENTS OF CASH FLOWS
YEARS ENDED DECEMBER 31, 2011 AND 2012
(Continued)
2
0
2
8
FINANCIAL INFORMATION
2
0
3
8
FINANCIAL INFORMATION