HTC 2012 Annual Report Download - page 75
Download and view the complete annual report
Please find page 75 of the 2012 HTC annual report below. You can navigate through the pages in the report by either clicking on the pages listed below, or by using the keyword search tool below to find specific information within the annual report.-
 1
1 -
2
-
3
-
4
-
5
-
6
-
7
-
8
-
9
-
10
-
11
-
12
-
13
-
14
-
15
-
16
-
17
-
18
-
19
-
20
-
21
-
22
-
23
-
24
-
25
-
26
-
27
-
28
-
29
-
30
-
31
-
32
-
33
-
34
-
35
-
36
-
37
-
38
-
39
-
40
-
41
-
42
-
43
-
44
-
45
-
46
-
47
-
48
-
49
-
50
-
51
-
52
-
53
-
54
-
55
-
56
-
57
-
58
-
59
-
60
-
61
-
62
-
63
-
64
-
 65
65 -
 66
66 -
 67
67 -
 68
68 -
 69
69 -
 70
70 -
 71
71 -
 72
72 -
 73
73 -
 74
74 -
 75
75 -
 76
76 -
 77
77 -
 78
78 -
 79
79 -
 80
80 -
 81
81 -
 82
82 -
 83
83 -
 84
84 -
 85
85 -
86
-
87
-
88
-
89
-
90
-
91
-
92
-
93
-
94
-
95
-
96
-
97
-
98
-
99
-
100
-
101
-
102
-
103
-
104
-
105
-
106
-
107
-
108
-
109
-
110
-
111
-
112
-
113
-
114
-
115
-
116
-
117
-
118
-
119
-
120
-
121
-
122
-
123
-
124
-
125
-
126
-
127
-
128
-
129
-
130
 |
 |

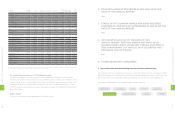
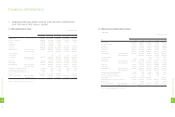
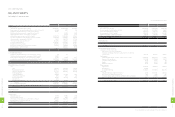
2. IFRS
Item As of 2013.3.31
Capital Structure Analysis (%) Debt Ratio (%) 60
Long-term Fund to Fixed Asset and Properties Ratio (%) 315
Liquidity Analysis (%)
Current Ratio (%) 108
Quick Ratio (%) 73
Debt Services Coverage Ratio (Times) 2,142
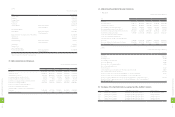
Operating Performance Analysis
Average Collection Turnover (Times) 4.60
Days Sales Outstanding 79
Average Inventory Turnover (Times) 3.80
Average Payment Turnover (Times) 1.83
Average Inventory Turnover Days 96
Fixed Asset and Property Turnover (Times) 6.60
Total Assets Turnover (Times) 0.83
Profitability Analysis
Return on Total Assets (%) 0.04
Return on Equity (%) 0.11
Paid-in Capital Ratio (%) Operating Income 0.51
Pre-tax Income 1.21
Net Margin (%) 0.2
Basic Earnings Per Share (NT$) 0.10
Cash Flow
Cash Flow Ratio (%) (18)
Cash Flow Adequacy Ratio (%) 109
Cash Flow Reinvestment Ratio (%) (6)
Leverage Operating Leverage 165.90
Financial Leverage 1.00
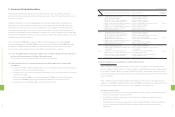
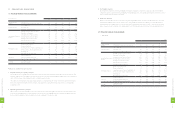
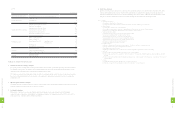
Analysis of variation for last two years:
1. Capital Structure & Liquidity Analyses
As of year-end 2012, our debt ratio stood at 61% the same as the 2011 level, current and quick ratios were both lower at
111% and 85%, respectively. This situation reflected decreased in revenue while maintaining cash dividend ratio, which
caused net cash outflow and drove current asset and quick asset to drop.
HTC carries no external loans and equity funds currently cover all expenditure needs. The interest expense entered into
the income statement primarily reflects interests on tax payments, causing an increase debt services coverage ratio
compared to 2011.
2. Operating Performance Analysis
Fixed asset turnover, total asset turnover, collection turnover, days sales outstanding, average inventory turnover were all
lowered compare to previous year due to decline in revenue.
3. Profitability Analysis
On the back of declines in revenue, profitability decreased compare to previous year given intensified market
competition, price competition, sustainability for a branding company. Net margin declined from 13% to 6% in 2011 to
2012, respectively. 2012 EPS came to NT$20.17 pershare.
4. Cash Flow Analysis
Declines in revenue led to declins in net cash flows from operating activities, net cash flow ratio declined to 18%, while
having current liabilities also slowed. However, HTC was still able to expand office capacity for future growth, and
maintained cash dividend ratio for 2012, cash flow adequacy ratio came to 126%. Cash flow reinvestment ratio is lower
this year to maintain cash dividend ratio for 2012 and lowering net cash flows from operating activities.
Note 1: Glossary
a. Capital Structure Analysis
(1) Debt Ratio=Total Liabilities / Total Assets.
(2) Long-term Fund to Fixed Assets Ratio=(Shareholders' Equity + Long-term Liabilities) / Net Fixed Assets.
b. Liquidity Analysis
(1) Current Ratio=Current Assets / Current Liabilities.
(2) Quick Ratio=(Current Assets - Inventories - Prepaid Expenses-Deferred income tax-current) / Current Liabilities.
(3) Debt Services Coverage Ratio=Earnings before Interest and Taxes / Interest Expenses.
c. Operating Performance Analysis
(1) Average Collection Turnover= Net Sales / Average Trade Receivables.
(2) Days Sales Outstanding=365 / Average Collection Turnover.
(3) Average Inventory Turnover=Cost of Sales / Average Inventory.
(4) Average Payment Turnover=Cost of Sales / Average Trade Payables.
(5) Average Inventory Turnover Days=365 / Average Inventory Turnover.
(6) Fixed Assets Turnover=Net Sales / Net Fixed Assets.
(7) Total Assets Turnover=Net Sales / Total Assets.
d. Profitability Analysis
(1) Return on Total Assets=(Net Income + Interest Expenses * (1 - Effective Tax Rate) ) / Average Total Assets.
(2) Return on Equity=Net Income / Average Shareholders' Equity.
(3) Net Margin=Net Income / Net Sales.
(4) Earnings Per Share=(Net Income - Preferred Stock Dividend) / Weighted Average Number of Shares Outstanding.
e. Cash Flow
(1) Cash Flow Ratio=Net Cash Provided by Operating Activities / Current Liabilities.
(2) Cash Flow Adequacy Ratio=Five-year Sum of Cash from Operations / Five-year Sum of Capital Expenditures, Inventory Additions, and Cash
Dividend.
(3) Cash Flow Reinvestment Ratio=(Cash Provided by Operating Activities - Cash Dividends) / (Gross Fixed Assets + Investments + Other Assets +
Working Capital).
f. Leverage
(1) Operating Leverage=(Net Sales - Variable Cost) / Income from Operations.
(2) Financial Leverage=Income from Operations / (Income from Operations – Interest Expenses)
1
4
6
8
FINANCIAL INFORMATION
1
4
7
8
FINANCIAL INFORMATION