HTC 2012 Annual Report Download - page 81
Download and view the complete annual report
Please find page 81 of the 2012 HTC annual report below. You can navigate through the pages in the report by either clicking on the pages listed below, or by using the keyword search tool below to find specific information within the annual report.-
 1
1 -
2
-
3
-
4
-
5
-
6
-
7
-
8
-
9
-
10
-
11
-
12
-
13
-
14
-
15
-
16
-
17
-
18
-
19
-
20
-
21
-
22
-
23
-
24
-
25
-
26
-
27
-
28
-
29
-
30
-
31
-
32
-
33
-
34
-
35
-
36
-
37
-
38
-
39
-
40
-
41
-
42
-
43
-
44
-
45
-
46
-
47
-
48
-
49
-
50
-
51
-
52
-
53
-
54
-
55
-
56
-
57
-
58
-
59
-
60
-
61
-
62
-
63
-
64
-
65
-
66
-
67
-
68
-
69
-
70
-
 71
71 -
 72
72 -
 73
73 -
 74
74 -
 75
75 -
 76
76 -
 77
77 -
 78
78 -
 79
79 -
 80
80 -
 81
81 -
 82
82 -
 83
83 -
 84
84 -
 85
85 -
 86
86 -
 87
87 -
 88
88 -
 89
89 -
 90
90 -
 91
91 -
92
-
93
-
94
-
95
-
96
-
97
-
98
-
99
-
100
-
101
-
102
-
103
-
104
-
105
-
106
-
107
-
108
-
109
-
110
-
111
-
112
-
113
-
114
-
115
-
116
-
117
-
118
-
119
-
120
-
121
-
122
-
123
-
124
-
125
-
126
-
127
-
128
-
129
-
130
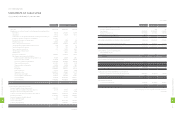
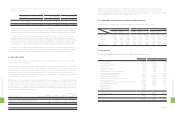
 |
 |

2011 2012
NT$ NT$ US$ (Note 3)
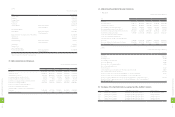
CASH FLOWS FROM FINANCING ACTIVITIES
Decrease in guarantee deposits received - (628) (21)
Cash dividends (29,891,089) (33,249,085) (1,141,443)
Purchase of treasury stock (16,135,808) (3,700,346) (127,033)
Transfer treasury stock to employees 4,113,821 - -
Net cash used in financing activities (41,913,076) (36,950,059) (1,268,497)
NET INCREASE (DECREASE) IN CASH AND CASH EQUIVALENTS 12,590,244 (34,365,491) (1,179,769)
CASH AND CASH EQUIVALENTS, BEGINNING OF YEAR 66,282,076 78,872,320 2,707,691
CASH AND CASH EQUIVALENTS, END OF YEAR $78,872,320 $44,506,829 $1,527,922
SUPPLEMENTAL CASH FLOW INFORMATION
Cash paid during the year
Interest $10,265 $320 $11
Income tax $6,406,264 $9,570,679 $328,562
NON-CASH INVESTING AND FINANCING ACTIVITIES
Transfer of retained earnings to stock dividends for distribution $403,934 $- $-
Transfer of assets leased to others to properties $50,828 $- $-
Retirement of treasury stock $8,509,336 $- $-
Transfer of accrued bonus to employees to stock dividends for distribution and
other capital surplus $4,245,851 $- $-
INCREASE IN LONG-TERM INVESTMENTS - EQUITY METHOD
Increase in investments accounted for by the equity method $23,145,450 $5,586,458 $191,783
Decrease in payable for purchase of investments 40,880 - -
Cash paid for increase in long-term investments $23,186,330 $5,586,458 $191,783
PURCHASE OF PROPERTIES
Cost of properties purchased $5,359,120 $6,042,237 $207,430
Increase in payable for purchase of equipment (30,185) (770,286) (26,444)
Cash paid for the purchase of properties $5,328,935 $5,271,951 $180,986
The accompanying notes are an integral part of the financial statements.
(Concluded)
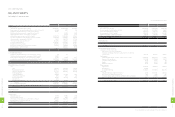
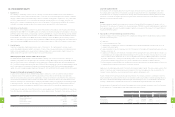
(In Thousands)
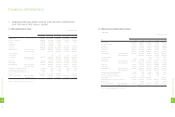
HTC CORPORATION
STATEMENTS OF CASH FLOWS
YEARS ENDED DECEMBER 31, 2011 AND 2012
2011 2012
NT$ NT$ US$ (Note 3)
CASH FLOWS FROM OPERATING ACTIVITIES
Net income $61,975,796 $16,780,968 $576,092
Adjustments to reconcile net income to net cash provided by operating activities
Depreciation 928,774 1,292,949 44,387
Amortization 397,022 524,391 18,002
Compensation cost recognized for the transfer of treasury stock to employees 1,788,270 - -
Distribution of bonuses to employees of subsidiaries (599,510) - -
Amortization of premium on financial assets 3,349 3,138 108
Prepaid pension costs (24,882) (22,184) (762)
Gains on equity-method investments (2,718,362) (617,608) (21,203)
Cash dividends received from equity-method investees 1,786 1,744 60
Transfer of properties to expenses 59 17,411 598
Gains on sale of investments, net (29) (7,695) (264)
Unrealized gain on financial assets - (10,467) (359)
Impairment loss - 45,017 1,546
Deferred income tax assets (1,768,812) (1,197,459) (41,109)
Net changes in operating assets and liabilities
Financial instruments at fair value through profit or loss 193,408 249,918 8,580
Notes and accounts receivable 3,139,262 12,296,013 422,123
Accounts receivable from related parties (4,790,878) 13,509,139 463,769
Other current financial assets (623,399) 180,380 6,192
Other receivables - related parties (42,892) 45,446 1,560
Inventories (3,468,828) 4,867,353 167,096
Prepayments (3,669,657) (585,542) (20,102)
Other current assets (101,225) 348,213 11,954
Other assets - other (5,289,930) 584,684 20,072
Notes and accounts payable 15,152,938 1,276,175 43,811
Accounts payable to related parties 2,292,250 (736,246) (25,275)
Income tax payable 3,236,423 (8,229,084) (282,505)
Accrued expenses 14,946,453 (11,608,359) (398,516)
Other current liabilities 4,753,191 (6,216,347) (213,407)
Net cash provided by operating activities 85,710,577 22,791,948 782,448
CASH FLOWS FROM INVESTING ACTIVITIES
Purchase of available-for-sale financial assets (490,000) - -
Proceeds of the sale of available-for-sale financial assets 200,029 739,095 25,373
Repayment of held-to-maturity financial assets - 100,000 3,433
Increase in investments accounted for by the equity method (23,186,330) (5,586,458) (191,783)
Purchase of properties (5,328,935) (5,271,951) (180,986)
Decrease (increase) in refundable deposits 303 (6,053) (208)
Increase in deferred charges (122,413) - -
Loan to related parties - (6,600,093) (226,582)
Increase in restricted assets - (3,581,920) (122,967)
Purchase of intangible assets (2,279,911) - -
Net cash used in investing activities (31,207,257) (20,207,380) (693,720)
(Continued)
1
5
8
8
FINANCIAL INFORMATION
1
5
9
8
FINANCIAL INFORMATION