HTC 2012 Annual Report Download - page 78
Download and view the complete annual report
Please find page 78 of the 2012 HTC annual report below. You can navigate through the pages in the report by either clicking on the pages listed below, or by using the keyword search tool below to find specific information within the annual report.-
 1
1 -
2
-
3
-
4
-
5
-
6
-
7
-
8
-
9
-
10
-
11
-
12
-
13
-
14
-
15
-
16
-
17
-
18
-
19
-
20
-
21
-
22
-
23
-
24
-
25
-
26
-
27
-
28
-
29
-
30
-
31
-
32
-
33
-
34
-
35
-
36
-
37
-
38
-
39
-
40
-
41
-
42
-
43
-
44
-
45
-
46
-
47
-
48
-
49
-
50
-
51
-
52
-
53
-
54
-
55
-
56
-
57
-
58
-
59
-
60
-
61
-
62
-
63
-
64
-
65
-
66
-
67
-
 68
68 -
 69
69 -
 70
70 -
 71
71 -
 72
72 -
 73
73 -
 74
74 -
 75
75 -
 76
76 -
 77
77 -
 78
78 -
 79
79 -
 80
80 -
 81
81 -
 82
82 -
 83
83 -
 84
84 -
 85
85 -
 86
86 -
 87
87 -
 88
88 -
89
-
90
-
91
-
92
-
93
-
94
-
95
-
96
-
97
-
98
-
99
-
100
-
101
-
102
-
103
-
104
-
105
-
106
-
107
-
108
-
109
-
110
-
111
-
112
-
113
-
114
-
115
-
116
-
117
-
118
-
119
-
120
-
121
-
122
-
123
-
124
-
125
-
126
-
127
-
128
-
129
-
130
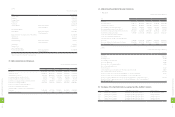
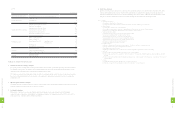
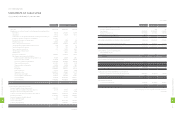
 |
 |

2011 2012
NT$ NT$ US$ (Note 3)
NON-OPERATING EXPENSES AND LOSSES
Interest expense $10,265 $320 $10
Impairment loss (Notes 2 and 15) - 45,017 1,546
Other 60,899 109,986 3,776
Total non-operating expenses and losses 71,164 155,323 5,332
INCOME BEFORE INCOME TAX 69,849,671 16,925,103 581,040
INCOME TAX (Notes 2 and 23) (7,873,875) (144,135) (4,948)
NET INCOME $61,975,796 $16,780,968 $576,092
2011 2012
Before
Income Tax
After
Income Tax
Before
Income Tax
After
Income Tax
NT$ NT$ NT$ US$ (Note 3) NT$ US$ (Note 3)
BASIC EARNINGS PER SHARE (Note 24) $82.63 $73.32 $20.34 $0.70 $20.17 $0.69
DILUTED EARNINGS PER SHARE (Note 24) $81.05 $71.91 $20.25 $0.70 $20.08 $0.69
The accompanying notes are an integral part of the financial statements.
(Concluded)
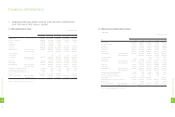
HTC CORPORATION
STATEMENTS OF INCOME
YEARS ENDED DECEMBER 31, 2011 AND 2012
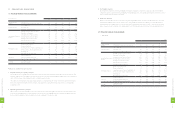
2011 2012
NT$ NT$ US$ (Note 3)
REVENUES (Notes 2 and 26)
Sales $456,791,548 $272,021,523 $9,338,512
Sales returns and allowances (2,533,270) (2,942,284) (101,009)
Net sales 454,258,278 269,079,239 9,237,503
Other operating revenues 820,908 1,622,448 55,699
Total revenue 455,079,186 270,701,687 9,293,202
COST OF REVENUES (Notes 11, 22 and 26) 335,325,140 213,712,615 7,336,764
GROSS PROFIT 119,754,046 56,989,072 1,956,438
UNREALIZED INTERCOMPANY GAINS (1,151,531) (2,354,363) (80,826)
REALIZED INTERCOMPANY GAINS 345,455 1,151,531 39,532
REALIZED GROSS PROFIT 118,947,970 55,786,240 1,915,144
OPERATING EXPENSES (Notes 22 and 26)
Selling and marketing 31,266,424 21,721,715 745,707
General and administrative 5,860,841 5,521,252 189,545
Research and development 16,960,163 13,780,378 473,081
Total operating expenses 54,087,428 41,023,345 1,408,333
OPERATING INCOME 64,860,542 14,762,895 506,811
NON-OPERATING INCOME AND GAINS
Interest income (Note 26) 622,365 504,794 17,330
Gains on equity-method investments (Notes 2 and 15) 2,718,362 617,608 21,203
Gains on sale of investments, net 29 7,695 264
Exchange gains, net (Note 2) 1,212,432 710,312 24,385
Valuation gains on financial instruments, net (Notes 2 and 6) 256,868 17,417 597
Other (Note 26) 250,237 459,705 15,782
Total non-operating income and gains 5,060,293 2,317,531 79,561
(Continued)
(In Thousands, Except Earnings Per Share)
1
5
2
8
FINANCIAL INFORMATION
1
5
3
8
FINANCIAL INFORMATION