HTC 2012 Annual Report Download - page 73
Download and view the complete annual report
Please find page 73 of the 2012 HTC annual report below. You can navigate through the pages in the report by either clicking on the pages listed below, or by using the keyword search tool below to find specific information within the annual report.-
 1
1 -
2
-
3
-
4
-
5
-
6
-
7
-
8
-
9
-
10
-
11
-
12
-
13
-
14
-
15
-
16
-
17
-
18
-
19
-
20
-
21
-
22
-
23
-
24
-
25
-
26
-
27
-
28
-
29
-
30
-
31
-
32
-
33
-
34
-
35
-
36
-
37
-
38
-
39
-
40
-
41
-
42
-
43
-
44
-
45
-
46
-
47
-
48
-
49
-
50
-
51
-
52
-
53
-
54
-
55
-
56
-
57
-
58
-
59
-
60
-
61
-
62
-
 63
63 -
 64
64 -
 65
65 -
 66
66 -
 67
67 -
 68
68 -
 69
69 -
 70
70 -
 71
71 -
 72
72 -
 73
73 -
 74
74 -
 75
75 -
 76
76 -
 77
77 -
 78
78 -
 79
79 -
 80
80 -
 81
81 -
 82
82 -
 83
83 -
84
-
85
-
86
-
87
-
88
-
89
-
90
-
91
-
92
-
93
-
94
-
95
-
96
-
97
-
98
-
99
-
100
-
101
-
102
-
103
-
104
-
105
-
106
-
107
-
108
-
109
-
110
-
111
-
112
-
113
-
114
-
115
-
116
-
117
-
118
-
119
-
120
-
121
-
122
-
123
-
124
-
125
-
126
-
127
-
128
-
129
-
130
 |
 |

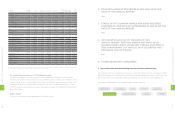
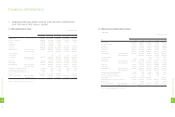
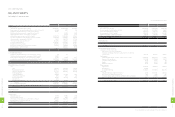
2. IFRS
Unit:NT$ thousands
Item As of 2013.3.31
Current Asset 133,045,634
Properties 25,840,345
Intangible Assets 11,677,252
Other Assets 33,589,387
Total Assets 204,152,618
Current Liabilities Before Appropriation 122,795,507
After Appropriation *
Non-Current Liabilities 418,183
Total Liabilities Before Appropriation 123,213,690
After Appropriation *
Equity Attribute to The Shareholders Of The Parents 80,938,928
Capital Stock 8,520,521
Capital surplus 16,601,557
Retained Earnings Before Appropriation 70,187,157
After Appropriation *
Other Equity (304,817)
Treasury Stock (14,065,490)
Non-Controlling Interest -
Total Stockholders' Equity Before Appropriation 80,938,928
After Appropriation *
*Subject to change after shareholders' meeting resolution
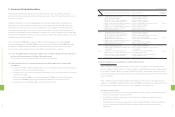
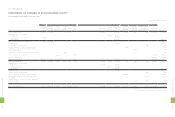
(3) Abbreviated Income Statements
NT$ thousands (Except EPS:NT$)
Item Year
2012 2011 2010 2009 2008
Revenues 270,701,687 455,079,186 275,046,954 144,880,715 152,558,766
Gross Profit (Note 1) 56,989,072 119,754,046 79,556,972 45,862,483 50,641,854
Operating Income (Note 1) 14,762,895 64,860,542 42,295,343 24,174,994 30,256,385
Non-operating Income and Gains (Note 1) 2,317,531 5,060,293 2,536,080 1,623,362 2,300,018
Non-operating Expenses and Losses (Note 1) 155,323 71,164 340,114 585,892 965,924
Income from Continuing Operations before Income Tax 16,925,103 69,849,671 44,491,309 25,212,464 31,590,479
Income from Continuing Operations 16,780,968 61,975,796 39,533,600 22,608,902 28,635,349
Income (Loss) from Discontinued Operations
Income (Loss) from Extraordinary Items
Cumulative Effect of Changes in Accounting Principle
Net Income 16,780,968 61,975,796 39,533,600 22,608,902 28,635,349
Basic Earnings Per Share 20.17 73.32 46.18 26.04 32.80
(4) Abbreviated Consolidated Income Statements
1. ROC GAAP
NT$ thousands (Except EPS:NT$)
Item Year
2012 2011 2010 2009 2008
Revenues 289,020,175 465,794,773 278,761,244 144,492,518 152,353,176
Gross Profit (Note 1) 72,925,077 131,797,527 83,868,739 46,162,981 50,990,638
Operating Income (Note 1) 18,819,707 68,787,767 44,132,581 24,622,907 30,345,270
Non-operating Income and Gains (Note 1) 2,240,310 2,783,264 1,142,944 1,420,086 2,319,489
Non-operating Expenses and Losses (Note 1) 1,609,559 147,344 311,137 646,581 929,043
Income from Continuing Operations before Income Tax 19,450,458 71,423,687 44,964,388 25,396,412 31,735,716
Income from Continuing Operations 17,589,186 62,299,048 39,514,844 22,614,413 28,552,526
Income (Loss) from Discontinued Operations
Income (Loss) from Extraordinary Items
Cumulative Effect of Changes in Accounting Principle
Net Income 17,589,186 62,299,048 39,514,844 22,614,413 28,552,526
Net Income Attribute to Shareholders of the Parent 16,780,968 61,975,796 39,533,600 22,608,902 28,635,349
Basic Earnings Per Share 20.17 73.32 46.18 26.04 32.80
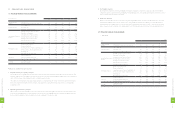
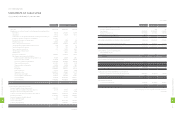
2. IFRS
Unit: NT$ thousands (Expect EPS:NT$)
Item As of 2013.3.31
Revenue 42,788,517
Gross Profit 8,682,152
Operating Income 43,358
Non-operating Income and Gains 59,387
Net Income Before Tax 102,745
Net Income from Continuing Operations 85,126
Non-Continuing Operations Loss -
Net Income(Loss) 85,126
Other Comprehensive Income and Loss for The Period, Net of Income Tax 581,108
Total Comprehensive Income for The Period 666,234
Allocations of Profit or Loss for The Period Attributable to: Owners of The Parent 85,126
Allocations of Profit or Loss for The Period Attributable to: Non-Controlling Interest -
Allocations of Total Comprehensive Income for The Period Attributable to: Owners of The Parent 666,234
Allocations of Total Comprehensive Income for The Period Attributable to: Non-Controlling Interest -
Basic Earnings Per Share 0.1
(5) The Name of the Certified Public Accountant and the Auditor's Opinion
Year CPA Firm Certified Public Accountant Auditor's Opinion
2008 Deloitte Touche Tohmatsu Ming-Hsien Yang and Kwan-Chung Lai Modified Unqualified Opinion
2009 Deloitte Touche Tohmatsu Ming-Hsien Yang and Tze-Chun Wang Unqualified Opinion
2010 Deloitte Touche Tohmatsu Ming-Hsien Yang and Tze-Chun Wang Unqualified Opinion
2011 Deloitte Touche Tohmatsu Ming-Hsien Yang and Tze-Chun Wang Unqualified Opinion
2012 Deloitte Touche Tohmatsu Ming-Hsien Yang and Tze-Chun Wang Unqualified Opinion
1
4
2
8
FINANCIAL INFORMATION
1
4
3
8
FINANCIAL INFORMATION