HTC 2012 Annual Report Download - page 92
Download and view the complete annual report
Please find page 92 of the 2012 HTC annual report below. You can navigate through the pages in the report by either clicking on the pages listed below, or by using the keyword search tool below to find specific information within the annual report.-
 1
1 -
2
-
3
-
4
-
5
-
6
-
7
-
8
-
9
-
10
-
11
-
12
-
13
-
14
-
15
-
16
-
17
-
18
-
19
-
20
-
21
-
22
-
23
-
24
-
25
-
26
-
27
-
28
-
29
-
30
-
31
-
32
-
33
-
34
-
35
-
36
-
37
-
38
-
39
-
40
-
41
-
42
-
43
-
44
-
45
-
46
-
47
-
48
-
49
-
50
-
51
-
52
-
53
-
54
-
55
-
56
-
57
-
58
-
59
-
60
-
61
-
62
-
63
-
64
-
65
-
66
-
67
-
68
-
69
-
70
-
71
-
72
-
73
-
74
-
75
-
76
-
77
-
78
-
79
-
80
-
81
-
 82
82 -
 83
83 -
 84
84 -
 85
85 -
 86
86 -
 87
87 -
 88
88 -
 89
89 -
 90
90 -
 91
91 -
 92
92 -
 93
93 -
 94
94 -
 95
95 -
 96
96 -
 97
97 -
 98
98 -
 99
99 -
 100
100 -
 101
101 -
 102
102 -
103
-
104
-
105
-
106
-
107
-
108
-
109
-
110
-
111
-
112
-
113
-
114
-
115
-
116
-
117
-
118
-
119
-
120
-
121
-
122
-
123
-
124
-
125
-
126
-
127
-
128
-
129
-
130
 |
 |

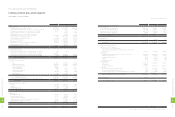
(2) Derivative financial instruments
December 31
2011 2012
Carrying Amount Fair Value Carrying Amount Fair Value
NT$ NT$ NT$ US$ (Note 3) NT$ US$ (Note 3)
Assets
Financial assets at fair value through profit or loss
- current $256,868 $256,868 $6,950 $238 $6,950 $238
Hedging derivative assets - current - - 204,519 7,021 204,519 7,021
2. Methods and Assumptions Used in Determining Fair Values of Financial Instruments
The financial instruments listed above don't include cash and cash equivalents, receivables, other current financial assets,
payables, accrued expenses and other current financial liabilities, which have carrying amounts that approximate their
fair values because of their short maturities.
For other non-current financial assets or liabilities, their fair values are based on the present value of future cash flows
discounted at the average interest rates for time deposits with maturities similar to those of the financial instruments.
The fair values of financial instruments at fair value through profit or loss or available for sale, hedging derivative financial
instruments and held-to-maturity financial assets are based on quoted market prices in an active market, and their fair
values can be reliably measured. If the securities do not have market prices, fair value is measured on the basis of other
financial information. The Company uses estimates and assumptions that are consistent with information that market
participants would use in setting a price for these securities with no quoted market prices.
Financial assets carried at cost are investments in unquoted shares, which have no quoted prices in an active market and
entail an unreasonably high cost to obtain verifiable fair values. Therefore, no fair value is presented.
3. Fair Values of Financial Instruments Based on Quoted Market Prices or Estimates Made through Valuation
Methods
Fair Values Based on
Quoted Market Prices
Fair Values Based on
Estimates Made through Valuation
Methods
December 31 December 31
2011 2012 2011 2012
NT$ NT$ US$ (Note 3) NT$ NT$ US$ (Note 3)
Assets
Financial assets at fair value through profit or loss - current $- $- $- $256,868 $6,950 $238
Hedging derivative assets - current - - - - 204,519 7,021
Available-for-sale financial assets - current 736,031 - - - - -
Held-to-maturity financial assets - current - 101,436 3,482 - - -
Available-for-sale financial assets - non-current 279 197 7 - - -
Held-to-maturity financial assets - non-current 203,783 - - - - -
Financial assets carried at cost - non-current - - - 515,861 515,861 17,710
The Company recognized unrealized gain of NT$3,824 thousand and unrealized loss of NT$4,713 thousand (US$162
thousand) in 2011 and 2012, respectively, under stockholders' equity for the changes in fair value of available-for-sale
financial assets.
As of December 31, 2011 and 2012, financial assets exposed to fair value interest rate risk amounted to NT$204,597
thousand NT$101,459 thousand (US$3,483 thousand) respectively; financial assets exposed to cash flow interest rate risk
amounted to NT$57,082,965 thousand and NT$18,602,147 thousand (US$638,612 thousand), respectively.
24. EARNINGS PER SHARE
Earnings per share ("EPS") before tax and after tax are calculated by dividing net income by the weighted average number
of common shares outstanding which includes the deduction of the effect of treasury stock during each year. EPS in 2011
were calculated after the average number of shares outstanding that was adjusted retroactively for the effect of stock
dividend distribution in 2012.
The Accounting Research and Development Foundation issued Interpretation 2007-052 that requires companies to
recognize bonuses paid to employees, directors and supervisors as compensation expenses beginning January 1, 2008.
These bonuses were previously recorded as appropriations from earnings. If the Company may settle the bonus to
employees by cash or shares, the Company should presume that the entire amount of the bonus will be settled in shares
and the resulting potential shares should be included in the weighted average number of shares outstanding used in the
calculation of diluted EPS, if the shares have a dilutive effect. The number of shares is estimated by dividing the entire
amount of the bonus by the closing price of the shares at the balance sheet date. Such dilutive effects of the potential shares
needs to be included in the calculation of diluted EPS until the stockholders resolve the number of shares to be distributed to
employees at their meeting in the following year. The related EPS information for 2011 and 2012 is as follows:
2011
Amount (Numerator) Shares
(Denominator)
(In Thousands)
EPS (In Dollars)
Before Income Tax
NT$
After Income Tax
NT$
Before Income Tax
NT$
After Income Tax
NT$
Basic EPS $69,849,671 $61,975,796 845,319 $82.63 $73.32
Bonus to employees - - 16,527
Diluted EPS $69,849,671 $61,975,796 861,846 $81.05 $71.91
2012
Amount (Numerator) Shares
(Denominator)
(In Thousands)
EPS (In Dollars)
Before Income Tax
NT$
After Income Tax
NT$
Before Income Tax
NT$
After Income Tax
NT$
Basic EPS $16,925,103 $16,780,968 831,980 $20.34 $20.17
Bonus to employees - - 3,748
Diluted EPS $16,925,103 $16,780,968 835,728 $20.25 $20.08
2012
Amount (Numerator) Shares
(Denominator)
(In Thousands)
EPS (In Dollars)
Before Income Tax
US$ (Note 3)
After Income Tax
US$ (Note 3)
Before Income Tax
US$ (Note 3)
After Income Tax
US$ (Note 3)
Basic EPS $581,040 $576,091 831,980 $0.70 $0.69
Bonus to employees - - 3,748
Diluted EPS $581,040 $576,091 835,728 $0.70 $0.69
25. FINANCIAL INSTRUMENTS
1. Fair Value of Financial Instruments
(1) Non-derivative financial instruments
December 31
2011 2012
Carrying Amount Fair Value Carrying Amount Fair Value
NT$ NT$ NT$ US$ (Note 3) NT$ US$ (Note 3)
Assets
Available-for-sale financial assets - current $736,031 $736,031 $- $- $- $-
Held-to-maturity financial assets - current - - 101,459 3,483 101,436 3,482
Available-for-sale financial assets - non-current 279 279 197 7 197 7
Held-to-maturity financial assets - non-current 204,597 203,783 - - - -
Financial assets carried at cost - non-current 515,861 515,861 515,861 17,710 515,861 17,710
1
8
0
8
FINANCIAL INFORMATION
1
8
1
8
FINANCIAL INFORMATION