HTC 2012 Annual Report Download - page 90
Download and view the complete annual report
Please find page 90 of the 2012 HTC annual report below. You can navigate through the pages in the report by either clicking on the pages listed below, or by using the keyword search tool below to find specific information within the annual report.-
 1
1 -
2
-
3
-
4
-
5
-
6
-
7
-
8
-
9
-
10
-
11
-
12
-
13
-
14
-
15
-
16
-
17
-
18
-
19
-
20
-
21
-
22
-
23
-
24
-
25
-
26
-
27
-
28
-
29
-
30
-
31
-
32
-
33
-
34
-
35
-
36
-
37
-
38
-
39
-
40
-
41
-
42
-
43
-
44
-
45
-
46
-
47
-
48
-
49
-
50
-
51
-
52
-
53
-
54
-
55
-
56
-
57
-
58
-
59
-
60
-
61
-
62
-
63
-
64
-
65
-
66
-
67
-
68
-
69
-
70
-
71
-
72
-
73
-
74
-
75
-
76
-
77
-
78
-
79
-
 80
80 -
 81
81 -
 82
82 -
 83
83 -
 84
84 -
 85
85 -
 86
86 -
 87
87 -
 88
88 -
 89
89 -
 90
90 -
 91
91 -
 92
92 -
 93
93 -
 94
94 -
 95
95 -
 96
96 -
 97
97 -
 98
98 -
 99
99 -
 100
100 -
101
-
102
-
103
-
104
-
105
-
106
-
107
-
108
-
109
-
110
-
111
-
112
-
113
-
114
-
115
-
116
-
117
-
118
-
119
-
120
-
121
-
122
-
123
-
124
-
125
-
126
-
127
-
128
-
129
-
130
 |
 |

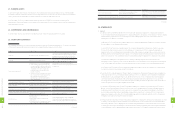
Based on the Securities and Exchange Act of the ROC, the number of reacquired shares should not exceed 10% of a
company's issued and outstanding shares, and the total purchase amount should not exceed the sum of the retained
earnings, additional paid-in capital in excess of par and realized capital surplus. In addition, the Company should not pledge
its treasury shares nor exercise rights to receive dividends and to vote.。
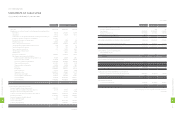
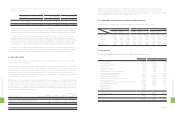
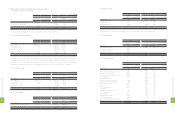
22. PERSONNEL, DEPRECIATION AND AMORTIZATION EXPENSES
As of December 31, 2011 and 2012, personnel expenses, depreciation and amortization were as follows:
2011 2012
Function
Expense Item
NT$ NT$ US$ (Note 3)
Operating
Costs
Operating
Expenses Total Operating
Costs
Operating
Expenses Total Operating
Costs
Operating
Expenses Total
Personnel expenses $5,628,162 $13,383,926 $19,012,088 $5,169,630 $7,273,740 $12,443,370 $177,474 $249,708 $427,182
Salary 4,564,767 12,511,284 17,076,051 4,010,009 6,271,378 10,281,387 137,664 215,297 352,961
Insurance 366,969 305,644 672,613 440,581 384,474 825,055 15,125 13,199 28,324
Pension cost 156,967 197,607 354,574 167,817 248,090 415,907 5,761 8,517 14,278
Other 539,459 369,391 908,850 551,223 369,798 921,021 18,924 12,695 31,619
Depreciation 504,199 424,575 928,774 687,259 605,690 1,292,949 23,594 20,793 44,387
Amortization 387,103 9,919 397,022 4,300 520,091 524,391 147 17,855 18,002
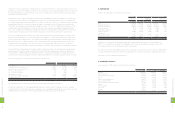
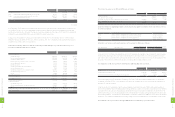
23. INCOME TAX
Income taxes payable as of December 31, 2011 and 2012 were computed as follows:
2011 2012
NT$ NT$ US$ (Note 3)
Income before income tax $69,849,671 $16,925,103 $581,040
Unrealized royalties 13,500,587 2,578,406 88,517
Unrealized intercompany gains 806,075 1,202,832 41,294
Capitalized expense 21,421 1,072,791 36,829
Unrealized bad-debt expenses 523,546 758,079 26,025
Unrealized sales allowance 176,442 395,378 13,573
Realized valuation gains on financial instruments 193,408 239,451 8,220
Unrealized materials and molding expenses 456,098 55,276 1,898
Unrealized (realized) marketing expenses 9,824,170 (10,025,081) (344,162)
Unrealized (realized) warranty expense 3,698,214 (5,974,552) (205,107)
Unrealized (realized) contingent losses on purchase orders 110,734 (1,229,876) (42,222)
Realized exchange losses, net (893,584) (939,650) (32,258)
Unrealized (realized) losses on obsolescence and scrappage of inventories 1,194,497 (750,832) (25,776)
Gains on equity-method investments (2,718,362) (617,608) (21,203)
Realized pension cost (24,882) (22,184) (762)
Realized investment loss (40,986) - -
Realized salary expense (700,000) - -
Others (89,782) 150,560 5,169
Total income 95,887,267 3,818,093 131,075
Less: Tax-exempt income (77,353,700) (1,841,362) (63,214)
Taxable income 18,533,567 1,976,731 67,861
Tax rate ×17% ×17% ×17%
Income tax payable determined pursuant to the Income Tax Law
(regular income taxes) $3,150,706 $336,044 $11,536
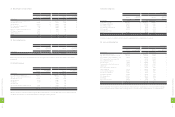
The bonus to employees for 2010 and 2011 approved in the stockholders' meetings on June 15, 2011 and June 12, 2012,
respectively, were as follows::
For 2010 For 2011
Amounts Approved in
Stockholders' Meetings
Amounts Recognized in
Financial Statements
Amounts Approved in
Stockholders' Meetings
Amounts Recognized in
Financial Statements
NT$ NT$ NT$ US$ (Note 3) NT$ US$ (Note 3)
Cash $4,245,853 $7,238,637 $248,503
Stock 4,245,851 - -
$8,491,704 $8,491,704 $7,238,637 $248,503 $7,238,637 $248,503
The number of shares of 4,006 thousand for 2010 was determined by dividing the amount of share bonus by the closing price (after
considering the effect of cash and stock dividends) of the day immediately preceding the stockholders' meeting. The approved
amounts of the bonus to employees were the same as the accrual amounts reflected in the financial statements for 2010 and 2011.
The employee bonus for 2011 and 2012 should be appropriated at 10% and 5%, respectively, of net income before deducting
employee bonus expenses. If the actual amounts subsequently resolved by the stockholders differ from the proposed amounts,
the differences are recorded in the year of stockholders' resolution as a change in accounting estimate. If bonus shares are resolved
to be distributed to employees, the number of shares is determined by dividing the amount of bonus by the closing price (after
considering the effect of cash and stock dividends) of the shares of the day immediately preceding the stockholders' meeting.
As of March 18, 2013, the date of the accompanying independent auditors' report, the 2012 earnings appropriation has not
been approved by the Company's Board of directors. Information about earnings appropriation and the bonus to employees,
directors and supervisors is available on the Market Observation Post System website of the Taiwan Stock Exchange.
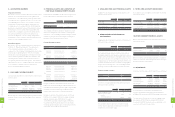
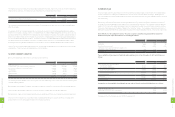
21. TREASURY STOCK
The Company resolved to transfer 6,000 thousand treasury stocks to employees in June 2011, and the number of shares
actually transferred was 5,875 thousand.
On July 16, 2011, the Company's board of directors passed a resolution to buy back from the open market 10,000 thousand
shares for each of the periods between July 18, 2011 and August 17, 2011 and between August 18, 2011 and September 17, 2011,
with the repurchase price ranging from NT$900 to NT$1,100 per share. When the share price was below the price floor of
the range, the Company would continue to buy back its shares. The Company bought back 20,000 thousand shares for
NT$16,086,098 thousand during the repurchase periods, retired 10,000 thousand shares in December 2011 and completed
the capital amendment registration in January 2012.
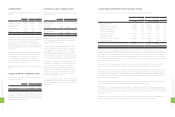
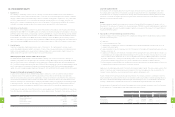
On December 20, 2011, the Company's board of directors passed a resolution to buy back 10,000 thousand of its shares from
the open market between December 20, 2011 and February 19, 2012, with the repurchase price ranging from NT$445 (US$15)
to NT$650 (US$22) per share. When the share price was below the price floor of the range, the Company would continue to
buy back its shares. The Company bought back 6,914 thousand shares (bought back 100 thousand shares in 2011 and 6,814
thousand shares in 2012) for NT$3,750,056 thousand (US$128,740 thousand) during the repurchase period. Other treasury
stock information for 2011 and 2012 were as follows:
(In Thousands of Shares)
Purpose of Treasury Stock Number of
Shares, Beginning of Year
Addition
During the Year
Reduction
During the Year
Number of
Shares, End of Year
2011
To maintain the Company's credibility and stockholders' interest - 10,000 10,000 -
To transfer shares to the Company's employees 9,786 10,100 5,875 14,011
9,786 20,100 15,875 14,011
2012
To transfer shares to the Company’s employees 14,011 6,814 - 20,825
(Continued)
1
7
6
8
FINANCIAL INFORMATION
1
7
7
8
FINANCIAL INFORMATION