HTC 2012 Annual Report Download - page 91
Download and view the complete annual report
Please find page 91 of the 2012 HTC annual report below. You can navigate through the pages in the report by either clicking on the pages listed below, or by using the keyword search tool below to find specific information within the annual report.-
 1
1 -
2
-
3
-
4
-
5
-
6
-
7
-
8
-
9
-
10
-
11
-
12
-
13
-
14
-
15
-
16
-
17
-
18
-
19
-
20
-
21
-
22
-
23
-
24
-
25
-
26
-
27
-
28
-
29
-
30
-
31
-
32
-
33
-
34
-
35
-
36
-
37
-
38
-
39
-
40
-
41
-
42
-
43
-
44
-
45
-
46
-
47
-
48
-
49
-
50
-
51
-
52
-
53
-
54
-
55
-
56
-
57
-
58
-
59
-
60
-
61
-
62
-
63
-
64
-
65
-
66
-
67
-
68
-
69
-
70
-
71
-
72
-
73
-
74
-
75
-
76
-
77
-
78
-
79
-
80
-
 81
81 -
 82
82 -
 83
83 -
 84
84 -
 85
85 -
 86
86 -
 87
87 -
 88
88 -
 89
89 -
 90
90 -
 91
91 -
 92
92 -
 93
93 -
 94
94 -
 95
95 -
 96
96 -
 97
97 -
 98
98 -
 99
99 -
 100
100 -
 101
101 -
102
-
103
-
104
-
105
-
106
-
107
-
108
-
109
-
110
-
111
-
112
-
113
-
114
-
115
-
116
-
117
-
118
-
119
-
120
-
121
-
122
-
123
-
124
-
125
-
126
-
127
-
128
-
129
-
130
 |
 |

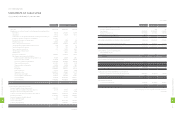
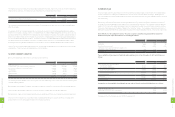
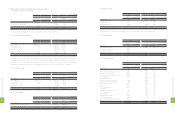
The income tax expenses in 2011 and 2012 were as follows:
2011 2012
NT$ NT$ US$ (Note 3)
Current income tax $9,588,529 $1,341,594 $46,057
Less: Effect of tax law changes - (1,298,103) (44,564)
(Less) add: (Increase) decrease in deferred income tax assets (1,768,812) 100,644 3,455
Add: Underestimation of prior years’ income tax 54,158 - -
Income tax $7,873,875 $144,135 $4,948
Under the Statute for Upgrading Industries, the Company was granted exemption from corporate income tax
for a five-year period:
The Year of Occurrence Item Exempt from Corporate Income Tax Exemption Period
2006 Sales of wireless or smartphone which has 3G or GPS function 2006.12.20-2011.12.19
2007 Sales of wireless or smartphone which has 3G or GPS function 2007.12.20-2012.12.19
2008 Sales of wireless or smartphone which has 3.5G function 2010.01.01-2014.12.31
2009 Sales of wireless or smartphone which has 3.5G function 2015.01.01-2018.09.30
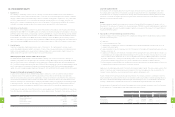
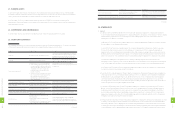
Information on the tax credit carryforwards as of December 31, 2012 was as follows:
Laws and Statutes Tax Credit Source Total Creditable Amount Remaining Creditable Amount Expiry
Year
NT$ US$ (Note 3) NT$ US$ (Note 3)
Statute for Upgrading Industries Research and development expenditures $2,375,184 $81,540 $1,644,674 $56,462 2013
Under Article 10 of the Statute for Industrial Innovation ("SII") passed by the Legislative Yuan in April 2010, a profit-seeking
enterprise may deduct up to 15% of its research and development expenditures from its income tax payable for the fiscal
year in which these expenditures are incurred, but this deduction should not exceed 30% of the income tax payable for that
fiscal year. This incentive took effect from January 1, 2010 and is effective till December 31, 2019.
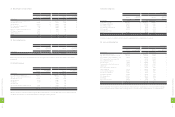
The imputation credit account ("ICA") information in 2011 and 2012 were as follows:
2011 2012
NT$ NT$ US$ (Note 3)
Balance of ICA $2,523,575 $5,966,033 $204,814
Unappropriated earnings from 1998 75,762,315 53,677,474 1,842,750
Actual/estimated creditable ratio (including income tax payable) 15.99%
(Actual ratio)
13.53%
(Estimated ratio)
13.53%
(Estimated ratio)
The actual creditable ratios for distribution of earnings of 2011 was 15.99% and estimated creditable ratios for distribution
of earnings of 2012 was 13.53%. In the calculation of the expected creditable ratio for 2012, the income taxes payable as of
December 31, 2012 was included.
Under Income Tax Act, for payment of profit-seeking enterprise income tax for the year of 1998 and the years thereafter, a
profit-seeking enterprise may, when making surplus earning distribution, cause its stockholders or association/society members
to deduct from the gross amount of tax payable as declared in their respective annual consolidated income tax return for the
current year the amount of income tax payable by them on the dividend or the surplus earning distributed to them by the said
profit-seeking enterprise. The imputation credit allocated to stockholders is based on its balance as of the date of the dividend
distribution. The estimated creditable ratio for 2012 may change when the actual distribution of the imputation credit is made.
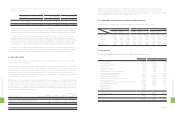
The Company's income tax returns through 2009 had been examined by the tax authorities.
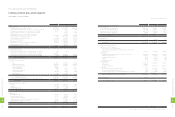
2011 2012
NT$ NT$ US$ (Note 3)
Alternative minimum tax $9,588,529 $382,378 $13,127
Add: Unappropriated earnings (additional 10% income tax) 865,772 2,310,999 79,337
Deduct: Investment research and development tax credits (865,772) (1,351,783) (46,407)
Prepaid and withheld income tax (61,661) (43,810) (1,504)
Add: Prior years' income tax payable 126,222 126,222 4,333
Income tax payable $9,653,090 $1,424,006 $48,886
(Concluded)
As of December 31, 2011 and 2012, the regular income taxes were less than the alternative minimum tax; thus, based on the
"Income Basic Tax Act," the income taxes payable should include the differences between the regular income taxes and
the alternative minimum tax. As a result, the current income taxes payable as of December 31, 2011 and 2012 should be NT$
9,588,529 thousand and NT$382,378 thousand (US$13,127 thousand), respectively.
In August 2012, the Legislative Yuan passed the amendment of Article 8 of the "Income Basic Tax Act," which increased
alternative minimum tax rate from 10% to 12%, effective January 1, 2013. The Company thus reassessed deferred tax assets
or liabilities in accordance with the revised article.
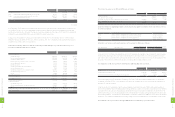
Deductible temporary dierences and tax credit carryforwards that gave rise to deferred tax assets as of
December 31, 2011 and 2012 were as follows:
2011 2012
NT$ NT$ US$ (Note 3)
Temporary differences
Unrealized royalties $4,817,745 $5,256,074 $180,441
Unrealized marketing expenses 4,344,683 2,640,419 90,646
Unrealized warranty expense 2,168,395 1,152,721 39,573
Allowance for loss on decline in value of inventory 787,303 659,661 22,646
Unrealized bad-debt expenses 153,355 282,229 9,689
Capitalized expense 69,244 251,619 8,638
Unrealized materials and molding expenses 138,502 147,899 5,077
Unrealized sales allowance 71,874 139,088 4,775
Unrealized contingent losses on purchase orders 348,990 139,911 4,803
Unrealized exchange losses, net 138,092 42,820 1,470
Others 102,064 369,993 12,702
Tax credit carryforwards 3,123,594 1,644,674 56,462
Total deferred tax assets 16,263,841 12,727,108 436,922
Less: Valuation allowance (10,962,549) (6,265,293) (215,088)
Total deferred tax assets, net 5,301,292 6,461,815 221,834
Deferred tax liabilities
Unrealized pension cost (31,251) (35,022) (1,202)
Unrealized valuation gains on financial instruments (43,668) (2,961) (102)
Others (112,551) (112,551) (3,863)
Deferred tax liabilities offset against deferred tax assets, net 5,113,822 6,311,281 216,667
Less: Current portion (1,517,302) (1,948,496) (66,892)
Deferred tax assets - non-current $3,596,520 $4,362,785 $149,775
1
7
8
8
FINANCIAL INFORMATION
1
7
9
8
FINANCIAL INFORMATION