HTC 2012 Annual Report Download - page 109
Download and view the complete annual report
Please find page 109 of the 2012 HTC annual report below. You can navigate through the pages in the report by either clicking on the pages listed below, or by using the keyword search tool below to find specific information within the annual report.-
 1
1 -
2
-
3
-
4
-
5
-
6
-
7
-
8
-
9
-
10
-
11
-
12
-
13
-
14
-
15
-
16
-
17
-
18
-
19
-
20
-
21
-
22
-
23
-
24
-
25
-
26
-
27
-
28
-
29
-
30
-
31
-
32
-
33
-
34
-
35
-
36
-
37
-
38
-
39
-
40
-
41
-
42
-
43
-
44
-
45
-
46
-
47
-
48
-
49
-
50
-
51
-
52
-
53
-
54
-
55
-
56
-
57
-
58
-
59
-
60
-
61
-
62
-
63
-
64
-
65
-
66
-
67
-
68
-
69
-
70
-
71
-
72
-
73
-
74
-
75
-
76
-
77
-
78
-
79
-
80
-
81
-
82
-
83
-
84
-
85
-
86
-
87
-
88
-
89
-
90
-
91
-
92
-
93
-
94
-
95
-
96
-
97
-
98
-
 99
99 -
 100
100 -
 101
101 -
 102
102 -
 103
103 -
 104
104 -
 105
105 -
 106
106 -
 107
107 -
 108
108 -
 109
109 -
 110
110 -
 111
111 -
 112
112 -
 113
113 -
 114
114 -
 115
115 -
 116
116 -
 117
117 -
 118
118 -
 119
119 -
120
-
121
-
122
-
123
-
124
-
125
-
126
-
127
-
128
-
129
-
130
 |
 |

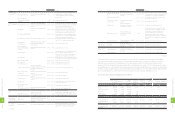
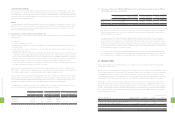
The Company's foreign-currency cash flows derived from
the highly probable forecast transaction may lead to risks on
foreign-currency financial assets and liabilities and estimated
future cash flows due to the exchange rate fluctuations. The
Company assesses the risks may be significant; thus, the
Company entered into derivative contracts to hedge against
foreign-currency exchange risks. The outstanding forward
exchange contracts as of December 31, 2012 were as follows:
Forward exchange contracts
2012
Currency Settlement Period/Date Contract Amount
Buy
USD/JPY 2013.03.28 US$95,356
Movements of hedging derivative financial instruments for
2011 and 2012 were as follows:
2011 2012
NT$ NT$ US$ (Note 3)
Balance, beginning of year $- $- $-
Add: Recognized in profit and loss - 10,467 359
Unrealized valuation gain - 194,052 6,662
Balance, end of year $- $204,519 $7,021
The unrealized valuation gain due to forward exchange
contract was recognized as unrealized gain on financial
instruments in stockholders' equity.
9. NOTES AND ACCOUNTS RECEIVABLE
Notes and accounts receivable as of December 31, 2011 and
2012 were as follows:
2011 2012
NT$ NT$ US$ (Note 3)
Notes receivable $755,450 $- $-
Accounts receivable 65,518,876 43,118,861 1,480,272
Accounts receivable from
related parties 473 221,050 7,589
66,274,799 43,339,911 1,487,861
Less: Allowance for
doubtful accounts (1,555,008) (2,086,085) (71,615)
$64,719,791 $41,253,826 $1,416,246
10. OTHER CURRENT FINANCIAL ASSETS
Other current financial assets as of December 31, 2011 and
2012 were as follows:
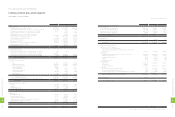
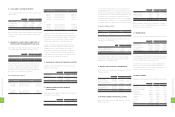
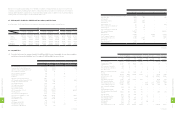
5. CASH AND CASH EQUIVALENTS
Cash and cash equivalents as of December 31, 2011 and 2012
were as follows:
2011 2012
NT$ NT$ US$ (Note 3)
Cash on hand $6,436 $15,433 $530
Checking accounts 9,709 12,134 417
Demand deposits 28,197,300 36,224,664 1,243,594
Time deposits 59,288,063 17,625,836 605,096
$87,501,508 $53,878,067 $1,849,637
On time deposits, interest rates ranged from 0.15% to 1.345%
and from 0.20% to 1.05% as of December 31, 2011 and 2012,
respectively.
6. FINANCIAL ASSETS AND LIABILITIES AT
FAIR VALUE THROUGH PROFIT OR LOSS
Financial assets and liabilities at fair value through profit or
loss as of December 31, 2011 and 2012 were as follows:
2011 2012
NT$ NT$ US$ (Note 3)
Derivatives - financial
assets
Exchange contracts $256,868 $6,950 $238
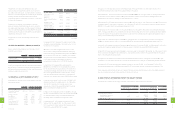
The Company entered into derivative transactions in 2011
and 2012 to manage exposures related to exchange rate
fluctuations. Outstanding forward exchange contracts
that did not meet the criteria for hedge accounting as of
December 31, 2011 and 2012 were as follows:
Forward Exchange Contracts
2011
Currency Settlement Period/Date Contract Amount
Buy
USD/CAD 2012.01.11-2012.02.22 USD28,010
USD/RMB 2012.01.04-2012.01.31 USD105,000
Sell
EUR/USD 2012.01.04-2012.03.30 EUR339,000
GBP/USD 2012.01.11-2012.02.22 GBP17,100
2012
Currency Settlement Period/Date Contract Amount
Sell
EUR/USD 2013.01.11-2013.03.27 EUR146,000
GBP/USD 2013.01.09-2013.03.20 GBP20,700
USD/NTD 2013.01.17-2013.02.20 USD70,000
USD/RMB 2013.01.09-2013.01.30 USD78,000
Buy
USD/RMB 2013.01.09-2013.01.30 USD106,000
USD/JPY 2013.01.09-2013.03.08 USD97,437
USD/CAD 2013.01.09-2013.02.22 USD22,158
USD/NTD 2013.01.07-2013.02.21 USD270,000
Net gain on derivative financial instruments in 2011 was
NT$172,501 thousand, including a realized settlement loss of
NT$84,367 thousand and a valuation gain of NT$256,868
thousand, which were classified as exchange loss and
valuation gain, respectively, on financial instruments.
Net gain on derivative financial instruments in 2012 was
NT$356,010 thousand (US$12,222 thousand), including
a realized settlement gain of NT$349,060 thousand
(US$11,984 thousand) and a valuation gain of NT$6,950
thousand (US$238 thousand), which were classified as
exchange gain and valuation gain on financial instruments,
respectively. Note 26 has more information.
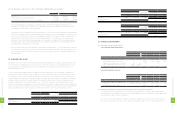
7. AVAILABLE-FOR-SALE FINANCIAL ASSETS
Available-for-sale financial assets as of December 31, 2011
and 2012 were as follows:
2011 2012
NT$ NT$ US$ (Note 3)
Quoted stocks $279 $38,099 $1,308
Mutual funds 736,031 - -
736,310 38,099 1,308
Less: Current portion (736,031) (37,902) (1,301)
$279 $197 $7
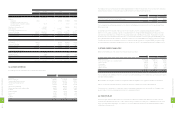
8. HEDGING DERIVATIVE FINANCIAL
INSTRUMENTS
Hedging derivative financial instruments as of December 31,
2011 and 2012 were as follows:
2011 2012
NT$ NT$ US$ (Note 3)
Hedging derivative assets $- $204,519 $7,021
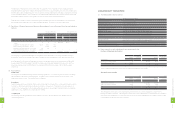
2011 2012
NT$ NT$ US$ (Note 3)
Other receivables $1,128,238 $1,121,912 $38,515
Agency payments 249,644 39,097 1,342
Interest receivable 23,261 8,067 277
Others 3,802 3,014 104
$1,404,945 $1,172,090 $40,238
Other receivables were primarily prepayments on behalf of
vendors or customers, withholding income tax of employees'
bonuses, and other compensation.
11. INVENTORIES
Inventories as of December 31, 2011 and 2012 were as follows:
2011 2012
NT$ NT$ US$ (Note 3)
Finished goods $2,189,984 $3,310,521 $113,650
Work-in-process 4,320,763 1,902,733 65,321
Semi-finished goods 4,547,374 5,635,374 193,463
Raw materials 17,251,140 12,663,961 434,754
Inventory in transit 121,329 296,788 10,189
$28,430,590 $23,809,377 $817,377
As of December 31, 2011 and 2012, the allowance for inventory
devaluation was NT$4,930,857 thousand and NT$4,936,776
thousand (US$169,480 thousand), respectively.
The write-down of inventories to their net realizable value
amounting to NT$3,381,137 thousand and NT$2,154,419
thousand (US$73,961 thousand) were recognized as cost of
revenues in 2011 and 2012, respectively.
12. PREPAYMENTS
Prepayments as of December 31, 2011 and 2012 were as follows:
2011 2012
NT$ NT$ US$ (Note 3)
Royalty $5,210,204 $2,609,254 $89,576
Prepayments to suppliers 299,105 854,799 29,345
Software and hardware
maintenance 311,416 716,695 24,604
Net input VAT 320,544 434,521 14,917
Molding equipment 188,242 96,859 3,325
Marketing 43,200 79,892 2,743
Service 7,209 62,877 2,159
Insurance 8,384 31,625 1,086
Rental 15,488 31,552 1,083
Others 103,724 47,740 1,639
$6,507,516 $4,965,814 $170,477
2
1
4
8
FINANCIAL INFORMATION
2
1
5
8
FINANCIAL INFORMATION