HTC 2012 Annual Report Download - page 72
Download and view the complete annual report
Please find page 72 of the 2012 HTC annual report below. You can navigate through the pages in the report by either clicking on the pages listed below, or by using the keyword search tool below to find specific information within the annual report.-
 1
1 -
2
-
3
-
4
-
5
-
6
-
7
-
8
-
9
-
10
-
11
-
12
-
13
-
14
-
15
-
16
-
17
-
18
-
19
-
20
-
21
-
22
-
23
-
24
-
25
-
26
-
27
-
28
-
29
-
30
-
31
-
32
-
33
-
34
-
35
-
36
-
37
-
38
-
39
-
40
-
41
-
42
-
43
-
44
-
45
-
46
-
47
-
48
-
49
-
50
-
51
-
52
-
53
-
54
-
55
-
56
-
57
-
58
-
59
-
60
-
61
-
 62
62 -
 63
63 -
 64
64 -
 65
65 -
 66
66 -
 67
67 -
 68
68 -
 69
69 -
 70
70 -
 71
71 -
 72
72 -
 73
73 -
 74
74 -
 75
75 -
 76
76 -
 77
77 -
 78
78 -
 79
79 -
 80
80 -
 81
81 -
 82
82 -
83
-
84
-
85
-
86
-
87
-
88
-
89
-
90
-
91
-
92
-
93
-
94
-
95
-
96
-
97
-
98
-
99
-
100
-
101
-
102
-
103
-
104
-
105
-
106
-
107
-
108
-
109
-
110
-
111
-
112
-
113
-
114
-
115
-
116
-
117
-
118
-
119
-
120
-
121
-
122
-
123
-
124
-
125
-
126
-
127
-
128
-
129
-
130
 |
 |

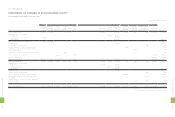
FINANCIAL INFORMATION
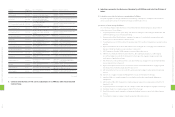
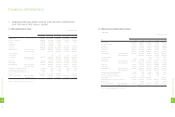
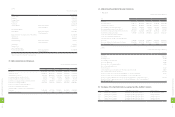
1. ABBREVIATED BALANCE SHEETS AND INCOME STATEMENTS
FOR THE PAST FIVE FISCAL YEARS
(1) Abbreviated Balance Sheets
Unit:NT$ thousands
Item
Year
2012 2011 2010 2009 2008
Current Assets 122,271,142 180,204,464 156,875,067 101,470,633 101,238,950
Long-term Investments 42,652,154 37,777,785 10,708,420 6,506,194 5,160,891
Properties 19,935,586 15,422,345 10,941,230 8,314,177 7,375,651
Intangible Assets 1,625,340 2,120,948 208,581 - -
Other Assets 12,702,516 12,585,381 5,317,155 3,330,938 1,450,870
Total Assets 199,186,738 248,110,923 184,050,453 119,621,942 115,226,362
Current Liabilities Before Appropriation 118,817,523 146,683,699 109,335,331 53,980,282 54,558,470
After Appropriation * 179,932,784 139,226,420 74,102,614 74,684,104
Long-term Liabilities - - - - -
Other Liabilities - 628 628 1,210 6,406
Total Liabilities Before Appropriation 118,817,523 146,684,327 109,335,959 53,981,492 54,564,876
After Appropriation * 179,933,412 139,227,048 74,103,824 74,690,510
Capital stock 8,520,521 8,520,521 8,176,532 7,889,358 7,553,938
Capital surplus 16,619,594 16,619,594 10,820,744 9,099,923 4,417,534
Retained Earnings Before Appropriation 70,148,728 86,616,845 63,150,566 48,637,773 52,036,321
After Appropriation * 53,367,760 32,855,543 28,128,473 31,537,990
Unrealized Loss On Financial Instruments 203,768 2,939 (885) (1,658) (1,632)
Cumulative Translation Adjustments (1,057,559) 32,134 (579,849) 15,088 65,602
Net Loss Not Recognized As Pension Cost (347) (293) (121) (34) -
Treasury Stock (14,065,490) (10,365,144) (6,852,493) - (3,410,277)
Total Stockholders' Equity Before Appropriation 80,369,215 101,426,596 74,714,494 65,640,450 60,661,486
After Appropriation * 68,177,511 44,823,405 45,518,118 40,535,852
*Subject to change after shareholders' meeting resolution.
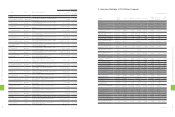
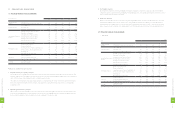
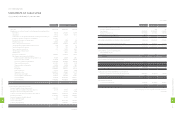
(2) Abbreviated Consolidated Balance Sheets
1. ROC GAAP
Unit:NT$ thousands
Item
Year
2012 2011 2010 2009 2008
Current Assets 139,658,980 192,859,891 168,606,486 104,867,841 104,223,660
Long-term Investments 10,197,272 3,685,262 1,232,145 810,485 541,437
Properties 25,651,292 21,512,478 14,024,329 9,899,808 8,916,350
Intangible Assets 11,520,674 22,560,788 935,650 240,482 289,783
Other Assets 19,575,908 15,178,544 5,583,134 3,610,401 1,771,180
Total Assets 206,604,126 255,796,963 190,381,744 119,429,017 115,742,410
Current Liabilities Before Appropriation 126,174,912 153,334,697 115,641,103 53,728,775 54,998,933
After Appropriation * 186,583,782 145,532,192 73,851,107 75,124,567
Long-term Liabilities - - 12,188 24,375 46,875
Other Liabilities 59,999 42,946 13,959 1,210 6,420
Total Liabilities Before Appropriation 126,234,911 153,377,643 115,667,250 53,754,360 55,052,228
After Appropriation * 186,626,728 145,558,339 73,876,692 75,177,862
Capital stock 8,520,521 8,520,521 8,176,532 7,889,358 7,553,938
Capital surplus 16,619,594 16,619,594 10,820,744 9,099,923 4,417,534
Retained Earnings Before Appropriation 70,148,728 86,616,845 63,150,566 48,637,773 52,036,321
After Appropriation * 53,367,760 32,855,543 28,128,473 31,537,990
Unrealized Loss On Financial Instruments 203,768 2,939 (885) (1,658) (1,632)
Cumulative Translation Adjustments (1,057,559) 32,134 (579,849) 15,088 65,602
Net Loss Not Recognized As Pension Cost (347) (293) (121) (34) -
Treasury Stock (14,065,490) (10,365,144) (6,852,493) - (3,410,277)
Equity Attribute To The Stockholders Of The Parent 80,369,215 101,426,596 74,714,494 65,640,450 60,661,486
Minority Interest - 992,724 - 34,207 28,696
Total Stockholders' Equity Before Appropriation 80,369,215 102,419,320 74,714,494 65,674,657 60,690,182
After Appropriation * 69,170,235 44,823,405 45,552,325 40,564,548
*Subject to change after shareholders' meeting resolution.
1
4
0
8
FINANCIAL INFORMATION
1
4
1
8
FINANCIAL INFORMATION