HTC 2012 Annual Report Download - page 74
Download and view the complete annual report
Please find page 74 of the 2012 HTC annual report below. You can navigate through the pages in the report by either clicking on the pages listed below, or by using the keyword search tool below to find specific information within the annual report.-
 1
1 -
2
-
3
-
4
-
5
-
6
-
7
-
8
-
9
-
10
-
11
-
12
-
13
-
14
-
15
-
16
-
17
-
18
-
19
-
20
-
21
-
22
-
23
-
24
-
25
-
26
-
27
-
28
-
29
-
30
-
31
-
32
-
33
-
34
-
35
-
36
-
37
-
38
-
39
-
40
-
41
-
42
-
43
-
44
-
45
-
46
-
47
-
48
-
49
-
50
-
51
-
52
-
53
-
54
-
55
-
56
-
57
-
58
-
59
-
60
-
61
-
62
-
63
-
 64
64 -
 65
65 -
 66
66 -
 67
67 -
 68
68 -
 69
69 -
 70
70 -
 71
71 -
 72
72 -
 73
73 -
 74
74 -
 75
75 -
 76
76 -
 77
77 -
 78
78 -
 79
79 -
 80
80 -
 81
81 -
 82
82 -
 83
83 -
 84
84 -
85
-
86
-
87
-
88
-
89
-
90
-
91
-
92
-
93
-
94
-
95
-
96
-
97
-
98
-
99
-
100
-
101
-
102
-
103
-
104
-
105
-
106
-
107
-
108
-
109
-
110
-
111
-
112
-
113
-
114
-
115
-
116
-
117
-
118
-
119
-
120
-
121
-
122
-
123
-
124
-
125
-
126
-
127
-
128
-
129
-
130
 |
 |

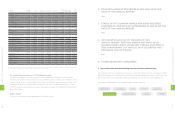
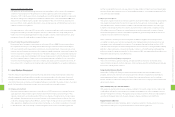
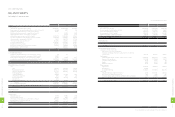
3. Profitability Analysis
On the back of declines in revenue, profitability decreased compared to the previous year given intensified market
competition, price competition and sustainability for branding activities. Net margin declined from 14% to 6% in 2011 to
2012. 2012 EPS came to NT$20.17 per share.
4. Cash Flow Analysis
Decline in revenue led to decline in net cash flows from operating activities, net cash flow ratio declined to 19%, while
having current liabilities also slowed. However, HTC was still able to expand office capacity for future growth, and
maintained the cash dividend ratio for 2012, and the cash flow adequacy ratio came to 129%. Cash flow reinvestment
ratio is lower this year to maintain cash dividend ratio for 2012 and lowering net cash flows from operating activities.
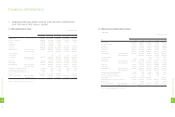
(2) Financial Analysis (Consolidated)
1. ROC GAAP
Item
Year
2012 2011 2010 2009 2008
Capital Structure
Analysis
Debt Ratio (%) 61 60 61 45 48
Long-term Fund to Fixed Assets Ratio (%) 313 476 533 664 681
Liquidity Analysis
Current Ratio (%) 111 127 146 195 190
Quick Ratio (%) 85 102 120 176 171
Debt Services Coverage Ratio (Times) 11,342 2,307 12,624 11,683 3,041
Operating Performance
Analysis
Average Collection Turnover (Times) 5.27 7.23 6.14 6.03 6.12
Days Sales Outstanding 69 50 59 61 60
Average Inventory Turnover (Times) 6.96 10.55 10.06 11.46 10.95
Average Payment Turnover (Times) 2.79 4.66 4.35 4.03 3.92
Average Inventory Turnover Days 52 35 36 32 33
Fixed Assets Turnover (Times) 11.27 21.65 19.88 14.6 17.09
Total Assets Turnover (Times) 1.4 1.83 1.46 1.21 1.32
Profitability Analysis
Return on Total Assets (%) 8 28 26 21 28
Return on Equity (%) 19 70 56 37 49
Operating Income to Paid-in Capital Ratio (%) 221 807 540 312 402
Pre-tax Income to Paid-in Capital Ratio (%) 228 838 550 322 420
Net Margin (%) 6 13 14 16 19
Basic Earnings Per Share (NT$) 20.17 73.32 46.18 26.04 32.80
Cash Flow
Cash Flow Ratio (%) 18 58 40 52 68
Cash Flow Adequacy Ratio (%) 126 158 150 192 211
Cash Flow Reinvestment Ratio (%) (11) 53 32 11 28
Leverage Operating Leverage 2.37 1.35 1.43 1.54 1.44
Financial Leverage 1 1 1 1 1
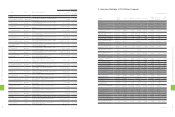
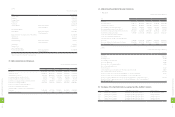
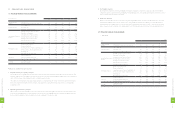
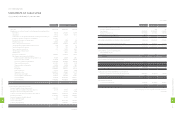
2. FINANCIAL ANALYSIS
(1) Financial Analysis (Unconsolidated)
Item (Note 2~3)
Year
2012 2011 2010 2009 2008
Capital Structure
Analysis
Debt Ratio (%) 60 59 59 45 47
Long-term Fund to Fixed Assets Ratio (%) 403 658 683 790 822
Liquidity Analysis
Current Ratio (%) 103 123 144 188 186
Quick Ratio (%) 80 100 120 171 169
Debt Services Coverage Ratio 52,892 6,806 967,203 192,463 136,167
Operating Performance
Analysis
Average Collection Turnover (Times) 5.02 6.95 5.92 4.92 6.09
Days Sales Outstanding 73 53 62 74 60
Average Inventory Turnover (Times) 7.85 12.11 11.77 11.71 12.68
Average Payment Turnover (Times) 2.78 4.85 4.59 3.72 4.08
Average Inventory Turnover Days 46 30 31 31 29
Fixed Assets Turnover (Times) 13.58 29.51 25.14 17.43 20.68
Total Assets Turnover (Times) 1.36 1.83 1.49 1.21 1.32
Profitability Analysis
Return on Total Assets (%) 8 29 26 22 28
Return on Equity (%) 18 70 56 37 49
Operating Income to Paid-in Capital Ratio (%) 173 761 517 306 401
Pre-tax Income to Paid-in Capital Ratio (%) 199 820 544 320 418
Net Margin (%) 6 14 14 16 19
Basic Earnings Per Share (NT$) 20.17 73.32 46.18 26.04 32.80
Cash Flow
Cash Flow Ratio (%) 19 58 37 51 69
Cash Flow Adequacy Ratio (%) 129 163 157 201 221
Cash Flow Reinvestment Ratio (%) (12) 52 26 11 28
Leverage Operating Leverage 2.37 1.35 1.43 1.54 1.44
Financial Leverage 1 1 1 1 1
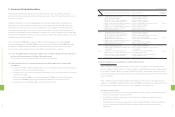
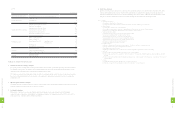
Analysis of variation for last two years:
1. Capital Structure & Liquidity Analyses
As of year-end 2012, our debt ratio stood at 60% as last year level and current and quick ratios were both lower at 103%
and 80%, respectively. This situation reflected declines in revenue while maintaining past dividend ratio which caused net
cash outflow to lower current and quick ratio compare to previous year.
HTC carries no external loans and equity funds currently cover all expenditure needs. The interest expense entered into
the income statement primarily reflects interests on tax payments, caused an increase debt services coverage ratio
compared to 2011.
2. Operating Performance Analysis
Due to decline in revenue, fixed asset turnover, total asset turnover, and average collection turnover were all lower than
the previous year. Operation cost also lowered, inventory and account payable items also decreased, causing inventory
turnover days and payment turnover days to be lower compared to the previous year.
1
4
4
8
FINANCIAL INFORMATION
1
4
5
8
FINANCIAL INFORMATION