HTC 2012 Annual Report Download - page 124
Download and view the complete annual report
Please find page 124 of the 2012 HTC annual report below. You can navigate through the pages in the report by either clicking on the pages listed below, or by using the keyword search tool below to find specific information within the annual report.-
 1
1 -
2
-
3
-
4
-
5
-
6
-
7
-
8
-
9
-
10
-
11
-
12
-
13
-
14
-
15
-
16
-
17
-
18
-
19
-
20
-
21
-
22
-
23
-
24
-
25
-
26
-
27
-
28
-
29
-
30
-
31
-
32
-
33
-
34
-
35
-
36
-
37
-
38
-
39
-
40
-
41
-
42
-
43
-
44
-
45
-
46
-
47
-
48
-
49
-
50
-
51
-
52
-
53
-
54
-
55
-
56
-
57
-
58
-
59
-
60
-
61
-
62
-
63
-
64
-
65
-
66
-
67
-
68
-
69
-
70
-
71
-
72
-
73
-
74
-
75
-
76
-
77
-
78
-
79
-
80
-
81
-
82
-
83
-
84
-
85
-
86
-
87
-
88
-
89
-
90
-
91
-
92
-
93
-
94
-
95
-
96
-
97
-
98
-
99
-
100
-
101
-
102
-
103
-
104
-
105
-
106
-
107
-
108
-
109
-
110
-
111
-
112
-
113
-
 114
114 -
 115
115 -
 116
116 -
 117
117 -
 118
118 -
 119
119 -
 120
120 -
 121
121 -
 122
122 -
 123
123 -
 124
124 -
 125
125 -
 126
126 -
 127
127 -
 128
128 -
 129
129 -
 130
130
 |
 |

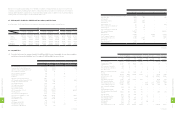
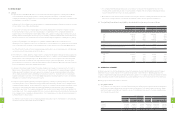
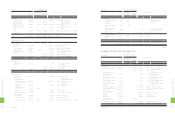
ROC GAAP Effect of the Transition from
ROC GAAP to IFRSs
IFRSs Amount Item Note
Item Amount
Measurement
or Recognition
Inconsistency
Presentation
Difference
NT$ NT$ NT$ NT$ US$ (Note 3)
Long-term investments
Available-for-sale financial
assets - noncurrent $197 $- $- $197 $7 Available-for-sale financial
assets - noncurrent
Financial assets carried at
cost - noncurrent 4,304,907 - - 4,304,907 147,788 Financial assets carried at
cost - noncurrent
Investments accounted
for by the equity method 5,892,168 - - 5,892,168 202,278 Investments accounted
for by the equity method
Total long-term investments 10,197,272 - - 10,197,272 350,073
Properties 25,651,292 - 339,474 25,990,766 892,264 Property, plant and
equipment g), h)
Intangible assets
Patents 9,180,674 - - 9,180,674 315,173 Patents
Goodwill 1,534,366 - - 1,534,366 52,675 Goodwill
Deferred pension cost 269 (269) - - - - d)
Other intangible assets 805,365 - 162,765 968,130 33,236 Other intangible assets g)
Total intangible assets 11,520,674 (269) 162,765 11,683,170 401,084
Other assets
Refundable deposits 190,142 - - 190,142 6,528 Refundable deposits
Deferred charges 897,164 - (897,164) - - Deferred charges g)
Long - term receivable 4,369,350 - - 4,369,350 150,000 Long - term receivable
Deferred income tax
assets - non-current 4,427,776 83,915 4,178,151 8,689,842 298,322 Deferred income tax
assets
b), c),
d)
Restricted assets - non-
current 3,660 - - 3,660 126 Restricted assets
Other 9,687,816 (86,716) 394,925 9,996,025 343,164 Other assets - other d), g),
h)
Total other assets 19,575,908 (2,801) 3,675,912 23,249,019 798,140
Total $206,604,126 ($3,070) $647,936
$207,248,992
$7,114,868
Liabilities and stockholders'
equity
Current liabilities
Notes and accounts
payable $73,618,197 $- $- $73,618,197 $2,527,316 Notes and accounts
payable
Income tax payable 2,713,373 - - 2,713,373 93,150 Current tax liabilities
Accrued expenses 37,376,493 93,451 - 37,469,944 1,286,345 Accrued expenses f)
Payable for purchase of
equipment 1,471,529 - - 1,471,529 50,518 Payable for purchase of
equipment
- - - 8,881,514 8,881,514 304,903 Provisions - current e)
Other current liabilities 10,995,320 - (8,881,514) 2,113,806 72,567 Other current liabilities e)
Total current liabilities 126,174,912 93,451 - 126,268,363 4,334,799
Other liabilities
Guarantee deposits
received 59,999 - - 59,999 2,060 Guarantee deposits
received
- - - 647,936 647,936 22,243 Deferred income tax
liabilities b)
59,999 - 647,936 707,935 24,303
Total liabilities 126,234,911 93,451 647,936 126,976,298 4,359,102
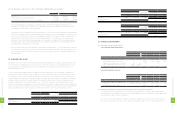
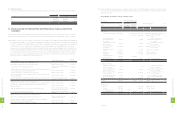
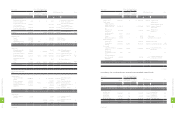
ROC GAAP Effect of the Transition from
ROC GAAP to IFRSs
IFRSs Amount Item Note
Item Amount
Measurement
or Recognition
Inconsistency
Presentation
Difference
NT$ NT$ NT$ NT$ US$ (Note 3)
Stockholders' equity
Common stock $8,520,521 $- $- $8,520,521 $292,510 Common stock
Capital surplus - - Capital surplus
Additional paid-in
capital - issuance of
shares in excess of
par
14,809,608 - - 14,809,608 508,415
Additional paid-in capital
- issuance of shares in
excess of par
Treasury stock
transactions 1,730,458 - - 1,730,458 59,407 Treasury stock
transactions
Long-term equity
investments 18,037 (18,037) - - - i)
Merger 24,423 - - 24,423 838 Merger
Expired stock options 37,068 - - 37,068 1,273 Expired stock options
Retained earnings
Legal reserve 16,471,254 - - 16,471,254 565,459 Legal reserve
Accumulated
earnings 53,677,474 (46,697) - 53,630,777 1,841,147 Accumulated earnings c), d),
f), i), j)
Other equity
Cumulative translation
adjustments (1,057,559) (32,134) - (1,089,693) (37,409) Cumulative translation
adjustments j)
Net loss not
recognized as pension
cost
(347) 347 - - - - d)
Unrealized valuation
gain on financial
instruments
203,768 - - 203,768 6,995 Unrealized valuation gain
on financial instruments
Treasury stock (14,065,490) - -
(14,065,490)
(482,869) Treasury stock
Total stockholders' equity 80,369,215 (96,521) - 80,272,694 2,755,766
Total $206,604,126 ($3,070) $647,936
$207,248,992
$7,114,868
(Concluded)
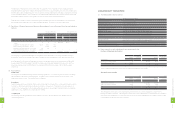
Reconciliation of the consolidated income statement for the year ended December 31, 2012:
ROC GAAP Effect of the Transition from
ROC GAAP to IFRSs
IFRSs Amount Item Note
Item Amount
Measurement
or Recognition
Inconsistency
Presentation
Difference
NT$ NT$ NT$ NT$ US$ (Note 3)
Revenues $289,020,175 $- $-
$289,020,175
$9,922,077 Revenues
Cost of revenues 216,095,098 (5,772) - 216,089,326 7,418,357 Cost of revenues d), f)
Gross profit 72,925,077 5,772 - 72,930,849 2,503,720 Gross profit
Operating expenses Operating expenses
Research and
development 15,489,969 3,170 - 15,493,139 531,880 Research and
development d), f)
General and
administrative 6,227,469 364 - 6,227,833 213,802 General and
administrative d), f)
Selling and marketing 32,387,932 (5,369) - 32,382,563 1,111,695 Selling and marketing d), f)
Total operating expenses 54,105,370 (1,835) - 54,103,535 1,857,377 Total operating expenses
Operating income 18,819,707 7,607 - 18,827,314 646,343 Operating income
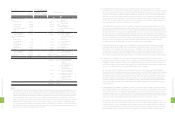
(Continued) (Continued)
2
4
4
8
FINANCIAL INFORMATION
2
4
5
8
FINANCIAL INFORMATION