HTC 2012 Annual Report Download - page 85
Download and view the complete annual report
Please find page 85 of the 2012 HTC annual report below. You can navigate through the pages in the report by either clicking on the pages listed below, or by using the keyword search tool below to find specific information within the annual report.
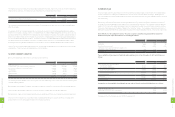
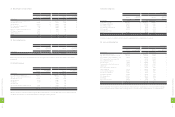
7. AVAILABLE-FOR-SALE FINANCIAL ASSETS
Available-for-sale financial assets as of December 31, 2011
and 2012 were as follows:
2011 2012
NT$ NT$ US$ (Note 3)
Mutual funds $736,031 $- $-
Domestic quoted stocks 279 197 7
736,310 197 7
Less: Current portion (736,031) - -
$279 $197 $7
8. HEDGING DERIVATIVE FINANCIAL
INSTRUMENTS
Hedging derivative financial instruments as of December 31,
2011 and 2012 were as follows:
2011 2012
NT$ NT$ US$ (Note 3)
Hedging derivative assets $- $204,519 $7,021
The Company's foreign-currency cash flows derived from
the highly probable forecast transaction may lead to risks on
foreign-currency financial assets and liabilities and estimated
future cash flows due to the exchange rate fluctuations. The
Company assesses the risks may be significant; therefore, the
Company entered into derivative contracts to hedge against
foreign-currency exchange risks. The outstanding forward
exchange contract as of December 31, 2012 was as follows:
Forward exchange contracts
2012
Currency Settlement Period/Date Contract Amount
Buy
USD/JPY 2013.03.28 USD95,356
Movements of hedging derivative financial instruments for
2011 and 2012 were as follows:
2011 2012
NT$ NT$ US$ (Note 3)
Balance, beginning of year $- $- $-
Add: Recognized in profit
and loss - 10,467 359
Unrealized valuation
loss - 194,052 6,662
Balance, end of year $- $204,519 $7,021
The unrealized valuation gain due to forward exchange
contract was recognized as unrealized gain on financial
instruments in stockholders' equity.
9. NOTES AND ACCOUNTS RECEIVABLE
Notes and accounts receivable as of December 31, 2011 and
2012 were as follows:
2011 2012
NT$ NT$ US$ (Note 3)
Notes receivable $755,450 $- $-
Accounts receivable 32,838,334 21,802,849 748,493
33,593,784 21,802,849 748,493
Less: Allowance for
doubtful accounts (1,554,008) (2,059,086) (70,689)
$32,039,776 $19,743,763 $677,804
10. OTHER CURRENT FINANCIAL ASSETS
Other current financial assets as of December 31, 2011 and
2012 were as follows:
2011 2012
NT$ NT$ US$ (Note 3)
Other receivables $1,036,838 $1,083,595 $37,200
Interest receivable 19,927 6,738 231
Agency payments 248,085 34,137 1,172
$1,304,850 $1,124,470 $38,603
Other receivables were primarily prepayments on behalf of
vendors or customers, withholding income tax of employees'
bonuses, and other compensation.
11. INVENTORIES
Inventories as of December 31, 2011 and 2012 were as follows:
2011 2012
NT$ NT$ US$ (Note 3)
Finished goods $675,712 $764,667 $26,251
Work-in-process 3,766,461 1,940,584 66,620
Semi-finished goods 4,083,050 3,954,056 135,743
Raw materials 16,788,114 13,652,134 468,679
Goods in transit 75,983 210,526 7,227
$25,389,320 $20,521,967 $704,520
As of December 31, 2011 and 2012, the allowances for
inventory devaluation were NT$4,631,195 thousand and
NT$3,880,363 thousand (US$133,213 thousand), respectively.
The write-down of inventories to their net realizable value
amounting to NT$3,197,362 thousand and NT$1,211,554
thousand (US$41,593 thousand) were recognized as cost of
revenues in 2011 and 2012, respectively.
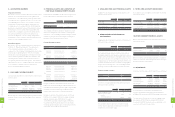
4. ACCOUNTING CHANGES
Financial Instruments
On January 1, 2011, the Company adopted the newly revised
SFAS No. 34 - "Financial Instruments: Recognition and
Measurement." The main revisions include (1) finance lease
receivables are now covered by SFAS No. 34; (2) the scope
of the applicability of SFAS No. 34 to insurance contracts
is amended; (3) loans and receivables originated by the
Company are now covered by SFAS No. 34; (4) additional
guidelines on impairment testing of financial assets carried
at amortized cost when a debtor has financial difficulties
and the terms of obligations have been modified; and (5)
accounting treatment by a debtor for modifications in
the terms of obligations. This accounting change had no
material effect on the Company's financial statements as of
and for the year ended December 31, 2011.
Operating Segments
On January 1, 2011, the Company adopted the newly issued
SFAS No. 41 - "Operating Segments." The requirements
of the statement are based on the information on the
components of the Company that management uses to make
decisions about operating matters. SFAS No. 41 requires
identification of operating segments on the basis of internal
reports that are regularly reviewed by the Company's chief
operating decision maker in order to allocate resources to
the segments and assess their performance. This statement
supersedes SFAS No. 20 - "Segment Reporting" and resulted
in the Company's compliance with the requirement to
disclose operating segment information.
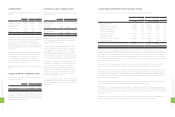
5. CASH AND CASH EQUIVALENTS
Cash and cash equivalents as of December 31, 2011 and 2012
were as follows:
2011 2012
NT$ NT$ US$ (Note 3)
Cash on hand $1,000 $1,010 $35
Checking accounts 7,903 4,562 157
Demand deposits 21,844,352 29,544,930 1,014,279
Time deposits 57,019,065 14,956,327 513,451
$78,872,320 $44,506,829 $1,527,922
On time deposits, interest rates ranged from 0.15% to 1.345%
and from 0.20% to 1.05%, as of December 31, 2011 and 2012,
respectively.
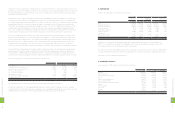
6. FINANCIAL ASSETS AND LIABILITIES AT
FAIR VALUE THROUGH PROFIT OR LOSS
Financial assets and liabilities at fair value through profit or
loss as of December 31, 2011 and 2012 were as follows:
2011 2012
NT$ NT$ US$ (Note 3)
Derivatives - financial
assets
Exchange contracts $256,868 $6,950 $238
The Company entered into derivative transactions in 2011
and 2012 to manage exposures related to exchange rate
fluctuations. The outstanding forward exchange contracts
that did not meet the criteria for hedge accounting as of
December 31, 2011 and 2012 were as follows:
Forward Exchange Contracts
2011
Currency Settlement Period/Date Contract Amount
Buy
USD/CAD 2012.01.11-2012.02.22 USD28,010
USD/RMB 2012.01.04-2012.01.31 USD105,000
Sell
EUR/USD 2012.01.04-2012.03.30 EUR339,000
GBP/USD 2012.01.11-2012.02.22 GBP17,100
2012
Currency Settlement Period/Date
Contract Amount
Sell
EUR/USD 2013.01.11-2013.03.27 EUR146,000
GBP/USD 2013.01.09-2013.03.20 GBP20,700
USD/NTD 2013.01.17-2013.02.20 USD70,000
USD/RMB 2013.01.09-2013.01.30 USD78,000
Buy
USD/RMB 2013.01.09-2013.01.30 USD106,000
USD/JPY 2013.01.09-2013.03.08 USD97,437
USD/CAD 2013.01.09-2013.02.22 USD22,158
USD/NTD 2013.01.07-2013.02.21 USD270,000
Net gain on derivative financial instruments in 2011 was
NT$173,575 thousand, including a realized settlement loss
of NT$83,293 thousand and valuation gain of NT$256,868
thousand, which were classified as exchange loss and
valuation gain, respectively, on financial instruments.
Net gain on derivative financial instruments in 2012 was
NT$356,010 thousand (US$12,222 thousand), including
realized settlement gain of NT$349,060 thousand
(US$11,984 thousand) and valuation gain of NT$6,950
thousand (US$238 thousand), which were classified as
exchange gain and valuation gain on financial instruments,
respectively. Note 25 has more information.
1
6
6
8
FINANCIAL INFORMATION
1
6
7
8
FINANCIAL INFORMATION


