HTC 2012 Annual Report Download - page 117
Download and view the complete annual report
Please find page 117 of the 2012 HTC annual report below. You can navigate through the pages in the report by either clicking on the pages listed below, or by using the keyword search tool below to find specific information within the annual report.-
 1
1 -
2
-
3
-
4
-
5
-
6
-
7
-
8
-
9
-
10
-
11
-
12
-
13
-
14
-
15
-
16
-
17
-
18
-
19
-
20
-
21
-
22
-
23
-
24
-
25
-
26
-
27
-
28
-
29
-
30
-
31
-
32
-
33
-
34
-
35
-
36
-
37
-
38
-
39
-
40
-
41
-
42
-
43
-
44
-
45
-
46
-
47
-
48
-
49
-
50
-
51
-
52
-
53
-
54
-
55
-
56
-
57
-
58
-
59
-
60
-
61
-
62
-
63
-
64
-
65
-
66
-
67
-
68
-
69
-
70
-
71
-
72
-
73
-
74
-
75
-
76
-
77
-
78
-
79
-
80
-
81
-
82
-
83
-
84
-
85
-
86
-
87
-
88
-
89
-
90
-
91
-
92
-
93
-
94
-
95
-
96
-
97
-
98
-
99
-
100
-
101
-
102
-
103
-
104
-
105
-
106
-
 107
107 -
 108
108 -
 109
109 -
 110
110 -
 111
111 -
 112
112 -
 113
113 -
 114
114 -
 115
115 -
 116
116 -
 117
117 -
 118
118 -
 119
119 -
 120
120 -
 121
121 -
 122
122 -
 123
123 -
 124
124 -
 125
125 -
 126
126 -
 127
127 -
128
-
129
-
130
 |
 |

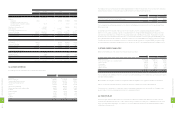
2012
Amount (Numerator) Shares
(Denominator)
(In Thousands)
EPS (In Dollars)
Before
Income Tax
After
Income Tax
Before
Income Tax
After
Income Tax
NT$ NT$ NT$ NT$
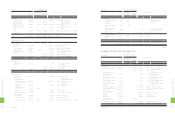
Basic EPS $16,925,103 $16,780,968 831,980 $20.34 $20.17
Bonus to employees - - 3,748
Diluted EPS $16,925,103 $16,780,968 835,728 $20.25 $20.08
2012
Amount (Numerator) Shares
(Denominator)
(In Thousands)
EPS (In Dollars)
Before
Income Tax
After
Income Tax
Before
Income T
ax
After
Income Tax
US$ (Note 3) US$ (Note 3) US$ (Note 3) US$ (Note 3)
Basic EPS $581,040 $576,092 831,980 $0.70 $0.69
Bonus to employees - - 3,748
Diluted EPS $581,040 $576,092 835,728 $0.70 $0.69
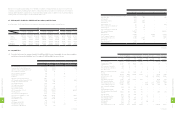
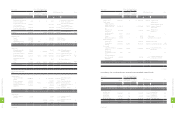
26. FINANCIAL INSTRUMENTS
(1) Fair Value of Financial Instruments
a. Non-derivative financial instruments
December 31
2011 2012
Carrying Amount Fair Value Carrying Amount Fair Value
NT$ NT$ NT$ US$ (Note 3) NT$ US$ (Note 3)
Assets
Available-for-sale financial assets - current $736,031 $736,031 $37,902 $1,301 $37,902 $1,301
Held-to-maturity financial assets - current - - 101,459 3,483 101,436 3,482
Available-for-sale financial assets - non-current 279 279 197 7 197 7
Held-to-maturity financial assets - non-current 204,597 203,783 - - - -
Financial assets carried at cost - non-current 3,408,654 3,408,654 4,304,907 147,788 4,304,907 147,788
b. Derivative financial instruments
December 31
2011 2012
Carrying Amount Fair Value Carrying Amount Fair Value
NT$ NT$ NT$ US$ (Note 3) NT$ US$ (Note 3)
Assets
Financial assets at fair value through profit or
loss - current $256,868 $256,868 $6,950 $238 $6,950 $238
Hedging derivative assets - current - - 204,519 7,021 204,519 7,021
(2) Methods and Assumptions Used in Determining Fair Values of Financial Instruments
The financial instruments listed above don’t include cash and cash equivalents, receivables, other current financial
assets, payables, accrued expenses and other current financial liabilities, which have carrying amounts that approximate
their fair values because of their short maturities.
For other non-current financial assets or liabilities, their fair values are based on the present value of future cash flows
discounted at the average interest rates for time deposits with maturities similar to those of the financial instruments.
(6) The imputation credit account (“ICA”) information in 2011 and 2012 were as follows:
2011 2012
NT$ NT$ US$ (Note 3)
Balance of ICA $2,523,575 $5,966,033 $204,814
Unappropriated earnings generated from 1998 75,762,315 53,677,474 1,842,750
Actual/estimated creditable ratio (including income tax payable) 15.99%
(Actual ratio)
13.53%
(Estimated ratio)
13.65%
(Estimated ratio)
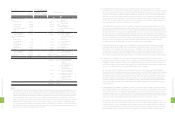
The actual creditable ratios for distribution of earnings of 2011 was 15.99% and estimated creditable ratios for
distribution of earnings of 2012 was 13.53%. In the calculation of the expected creditable ratio for 2012, the income
taxes payable as of December 31, 2012 was included.
Under Income Tax Act, for payment of profit-seeking enterprise income tax for the year of 1998 and the years thereafter,
a profit-seeking enterprise may, when making surplus earning distribution, cause its shareholders or association/society
members to deduct from the gross amount of tax payable as declared in their respective annual consolidated income
tax return for the current year the amount of income tax payable by them on the dividend or the surplus earning
distributed to them by the said profit-seeking enterprise. The imputation credit allocated to shareholders is based on
its balance as of the date of the dividend distribution. The estimated creditable ratio for 2012 may change when the
actual distribution of the imputation credit is made.
HTC's income tax returns through 2009 had been examined by the tax authorities. The income tax returns of CGC and
HTC Investment Corporation for the years through 2010 have been examined and approved by the tax authorities. The
income tax returns of HTC I Investment Corporation for the years through 2011 have been examined and approved by
the tax authorities.
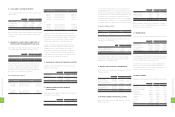
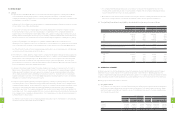
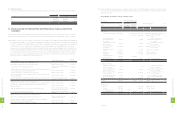
25. EARNINGS PER SHARE
Earnings per share ("EPS") before tax and after tax are calculated by dividing net income by the weighted average number
of common shares outstanding which includes the deduction of the effect of treasury stock during each year. EPS in 2011
were calculated after the average number of shares outstanding that was adjusted retroactively for the effect of stock
dividend distribution in 2012.
The Accounting Research and Development Foundation issued Interpretation 2007-052, which requires companies to
recognize bonuses paid to employees, directors and supervisors as compensation expenses beginning January 1, 2008.
These bonuses were previously recorded as appropriations from earnings. If the Company may settle to settle the bonus
to employees by cash or shares, the Company should presume that the entire amount of the bonus will be settled in shares
and the resulting potential shares should be included in the weighted average number of shares outstanding used in the
calculation of diluted EPS, if the shares have a dilutive effect. The number of shares is estimated by dividing the entire
amount of the bonus by the closing price of the shares at the balance sheet date. The dilutive effects of the potential shares
needs to be included in the calculation of diluted EPS until the stockholders resolve the number of shares to be distributed to
employees at their meeting in the following year. The related EPS information of HTC for 2011 and 2012 is as follows:
2011
Amount (Numerator) Shares
(Denominator)
(In Thousands)
EPS (In Dollars)
Before
Income Tax
After
Income Tax
Before
Income Tax
After
Income Tax
NT$ NT$ NT$ NT$
Basic EPS $69,849,671 $61,975,796 845,319 $82.63 $73.32
Bonus to employees - - 16,527
Diluted EPS $69,849,671 $61,975,796 861,846 $81.05 $71.91
2
3
0
8
FINANCIAL INFORMATION
2
3
1
8
FINANCIAL INFORMATION